Eight months ago, the financial sector couldn’t stayout of the news.
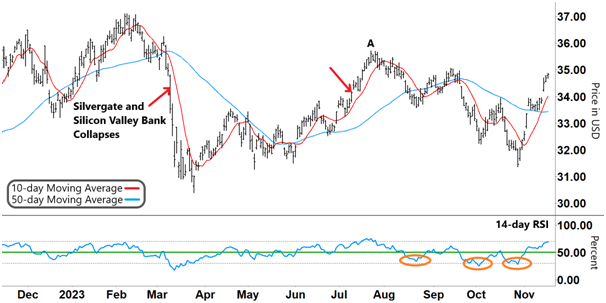
We saw a string of high-profile bank collapses, including Silvergate Bank and Silicon Valley Bank. And the Financial Select Sector SPDR Fund (XLF) lost over 15% in less than a month.
We checked in on XLF in July (red arrow in the chart below). At that time, it had bottomed out after the fall and was steadily recouping some of those losses.
But XLF peaked later that month before rolling over and falling again.
Now XLF has found a bottom once more and has been rallying strongly this past month.
So let’s see what’s ahead…
On the left side of the XLF chart below, you can see the huge impact of those bank collapses.
The almost vertical fall of the 10-day moving average (MA, red line) highlights the sharp sell-off. It plummeted after it crossed below the 50-day MA (blue line).
Financial Select Sector SPDR Fund (XLF)
Source: e-Signal
XLF’s recovery began later in March when the RSI formed a “V” and rallied out of oversold territory (lower gray dashed line).
XLF then made a series of higher peaks alongside two bullish technical signals.
First, the relative strength index (RSI) steadily trended higher. And it eventually gained a firm footing in its upper band (above the green line).
Second, the 10-day MA crossed back above the 50-day MA with both MAs trending higher.
But XLF peaked in July at “A” and began falling as we saw a complete reversal of those signals.
The RSI inverted from overbought territory (upper gray dashed line). Then it steadily tracked lower.
This down move saw the 10-day MA cross below the 50-day MA, and both the MAs trended down.
And within XLF’s downtrend, you’ll notice its succession of lower highs.
Take another look:
Financial Select Sector SPDR Fund (XLF)
Source: e-Signal
Each of the counter-rallies up those lower highs happened when the RSI formed a “V” and rallied from oversold territory (orange circles).
The RSI couldn’t get any traction in its upper band in the first two counter-rallies. But this last move saw the RSI burst strongly through resistance and track higher.
This strong momentum pushed XLF back to where it was trading in September.
And this caused the 10-day MA to sharply cross back above the 50-day MA.
But the RSI is on the verge of overbought territory. That could make XLF vulnerable to another pullback.
So what should we look for from here?
|
Free Trading Resources Have you checked out Larry’s free trading resources on his website? It contains a full trading glossary to help kickstart your trading career – at zero cost to you. Just click here to check it out. |
Just because a stock is in overbought territory, there is no guarantee that it will fall.
After all, the RSI can stay at this upper level for a while when a stock is rallying strongly.
But I’m watching whether another reversal could be in the cards (like we saw at “A”).
In the meantime, we need to be patient and see if the RSI clearly reverses before considering any short trade.
The other thing I’ll be watching is our shorter-term MA. If the 10-day MA rolls over, that would add further weight to any pullback.
Regards,
Larry Benedict
Editor, Trading With Larry Benedict
Do you think XLF will reverse? Let us know at feedback@opportunistictrader.com.
Reading Trading With Larry Benedict will allow you to take a look into the mind of one of the market’s greatest traders. You’ll be able to recognize and take advantage of trends in the market in no time.
