When tech stocks took off at the start of the year, one stock was left behind…
Adobe (ADBE) is a digital publishing company with popular products like Photoshop and Acrobat Reader. But it spent the first four months of 2023 stuck in a sideways trend.
That all changed in May.
As ADBE got pulled into the massive AI-inspired rally, its stock price quickly jumped.
But unlike other tech stocks that pulled back in late July, ADBE tracked sideways.
And it recently traded up to its yearly high.
So today, I want to see where ADBE could go next as we check out potential trades…
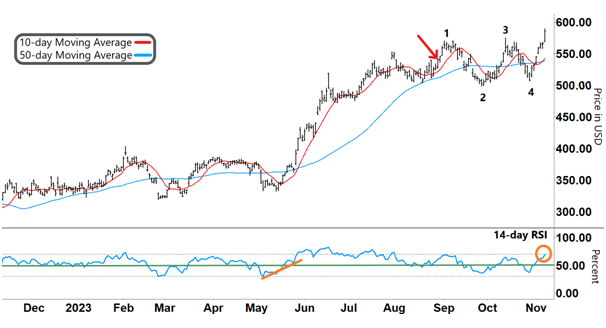
The chart of ADBE below shows its clear sideways pattern at the start of the year.
The 50-day moving average (MA, blue line) traded flat, and the shorter-term 10-day MA (red line) zigzagged closely over the top. This is common in a sideways pattern.
Then, in May, ADBE burst higher…
Adobe (ADBE)
Source: e-Signal
That rally began with the relative strength index (RSI) rising out of oversold territory (orange line).
ADBE accelerated upward when the RSI broke through resistance (green line).The RSI then gained a firm footing in the upper half of its range.
You can gauge the strength of ADBE’s move by how sharply the 10-day MA crossed and rose above the 50-day MA.
So after trading flat through June, ADBE started climbing again in July.
Big tech and the broader Nasdaq started selling off later that month. But ADBE only drifted slightly lower before making a new move higher.
When we checked in on ADBE at the end of August (red arrow), this upmove coincided with the RSI testing and rallying off support.
ADBE peaked in early September (see 1). And the RSI also reversed from overbought territory (upper gray dashed line).
Take another look:
Adobe (ADBE)
Source: e-Signal
After its reversal, ADBE transitioned into a sideways pattern again.
The 50-day MA flatlined with the 10-day MA crossing it in both directions.
As you can see, these peaks and troughs from 1 through 4 coincide with clear reversals in momentum (RSI).
Having made a trough at 4, ADBE burst higher yet again. And it recently traded at its highest level since December 2021.
But with the RSI once more pushing into overbought territory, what should we look out for from here?
|
Free Trading Resources Have you checked out Larry’s free trading resources on his website? It contains a full trading glossary to help kickstart your trading career – at zero cost to you. Just click here to check it out. |
We’re not trying to pick longer-term trends with our mean reversion strategy.
Instead, we’re looking for stocks that have overshot in one direction. We then aim to profit when those stocks reverse back the other way.
And that’s what I’m watching for with ADBE over the coming week.
If the RSI reverses out of overbought territory, ADBE will likely lock in a new short-term peak.
That move could set up a short trade to capture a quick reversion back to the mean.
Regards,
Larry Benedict
Editor, Trading With Larry Benedict
One reader chimed in with his thoughts on the recent essay on VanEck Gold Miners ETF (GDX). Here’s what he had to say about gold’s rally:
Gold price will remain choppy for the near term. Gold up slightly with FED rate increase, otherwise flat. Gold up with recession – after Christmas season.
– David G.
We love to hear about what our readers are watching, so share any of your thoughts at feedback@opportunistictrader.com.
Reading Trading With Larry Benedict will allow you to take a look into the mind of one of the market’s greatest traders. You’ll be able to recognize and take advantage of trends in the market in no time.
