|
Larry’s note: Welcome to Trading with Larry Benedict, the brand new free daily eletter, designed and written to help you make sense of today’s markets. I’m glad you can join us. My name is Larry Benedict. I’ve been trading the markets for over 30 years. I got my start in 1984, working in the Chicago Board Options Exchange. From there, I moved on to manage my own $800 million hedge fund, where I had 20 profitable years in a row. But these days, rather than just trading for billionaires, I spend a large part of my time helping regular investors make money from the markets. My goal with these essays is to give you insight on the most interesting areas of the market for traders right now. Let’s get right into it… |
Throughout the years, a number of controversies have put big oil companies on the map.
For example, the Deepwater Horizon oil spill in 2010… Or the Exxon Valdez spill from 1989.
These events helped push oil companies to the forefront of the public eye.
However, one closely aligned sector that’s often overlooked is the oil services sector.
The sector represents companies that provide support and equipment to upstream oil producers.
One way I trade this sector is through the VanEck Oil Services ETF (OIH).
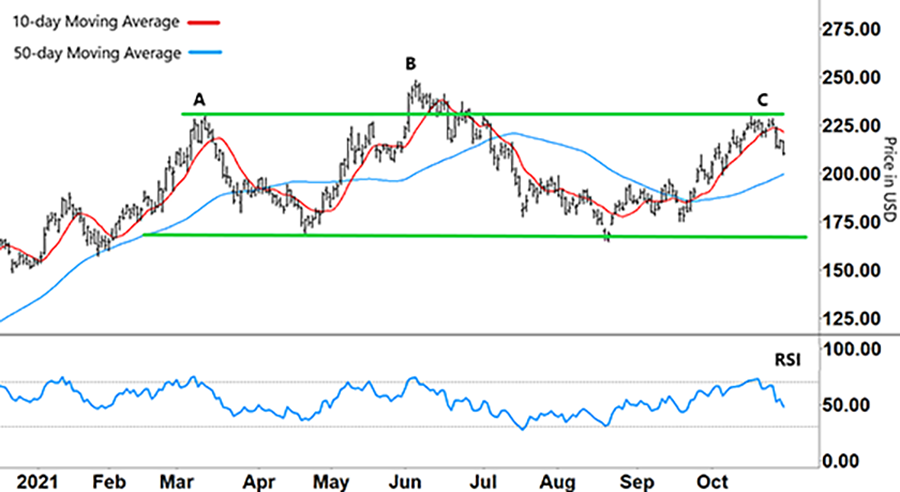
As you can see on the chart below, OIH rallied strongly from the start of the year to mid-March (A).
Then, after a pullback through late April, OIH rallied just under $245 (B) on June 4 to form its peak for the year (so far).
However, its price action since then tells me a new chart pattern could be unfolding…
VanEck Oil Services ETF (OIH)
Source: e-Signal
The rally that started in August recently came to an end in mid-October (C), before OIH rolled over and traded down this past week.
As the lower half of the chart shows, each of the highs at ‘A’, ‘B,’ and ‘C’ coincided with strong overbought signals from the Relative Strength Index (RSI).
However, the price level of the most recent peak (C) caught my attention…
As the upper green line shows, this most recent peak is at the same price level as the peak back in March (A).
And right now, OIH could be in the final stages of completing a head-and-shoulders pattern, where ‘A’ and ‘C’ are the shoulders, and ‘B’ is the head.
If you recall, we looked at this important chart pattern last week. And, we mentioned that this pattern can often lead to a major reversal. In the case with OIH, from an uptrend to a downtrend.
For the head-and-shoulders pattern to complete, OIH must first trade back down to the lower green line – also known as the neckline.
So, what are our indicators telling us?
First, the RSI is showing declining momentum. After reversing from an overbought signal (C), the RSI’s blue line is heading down.
And second, our short-term 10-day moving average (MA – red line) is also starting to roll over and decrease.
The next test is to see whether the 10-day MA will cross down over the 50-day MA (blue line).
The pullback in March (A) offers a handy reference…
VanEck Oil Services ETF (OIH)
Source: e-Signal
Back then, the two MAs converged before eventually crossing over. From top to bottom, the March pullback represented a 27% move.
If that chart pattern were to repeat with the current pullback, then that could provide plenty of opportunity to generate a tidy profit from going short.
However, a bigger opportunity will appear if the full head-and-shoulders pattern plays out…
For that to happen – after trading back down to the neckline (lower green line) – OIH will then need to break down through that lower level (lower green line).
When big trends go through major reversals, that can really provide some outsized profits. That’s why traders are always on the lookout for this kind of chart pattern.
However, like anything to do with the markets, patience is key.
First, these types of patterns can take months to fully form. By the time (and if) OIH completes the head-and-shoulders pattern, it will have taken around 9-10 months.
And second, once you enter your trade, you need to give it plenty of time to capture enough of the move.
There’s little point in waiting months for a chart pattern to form only to take your profits off the table within a few days. A major reversal can often trend back the other way for months… if not longer.
Right now, the chart pattern is looking very promising, meaning there could be plenty of trading opportunities ahead.
Regards,
Larry Benedict
Editor, Trading With Larry Benedict
P.S. We’re excited to hear what you think of your new eletter, Trading With Larry Benedict. Let us know at feedback@opportunistictrader.com.
Reading Trading With Larry Benedict will allow you to take a look into the mind of one of the market’s greatest traders. You’ll be able to recognize and take advantage of trends in the market in no time.
