Three years ago, Exxon Mobil (XOM) was struggling to hold above $30.
Fast-forward to February this year. The U.S. oil and gas giant was pushing $120 and had a market cap approaching half a trillion dollars.
Since then, though, XOM has struggled to move higher…
Even OPEC’s series of production cuts this year has failed to drive any prolonged rally. Instead, XOM has spent 2023 stuck in a sideways trend.
After a lackluster middle of the year, XOM has rallied these past couple of months. It could soon retest the upper level of its trading range.
Today, I want to see how things could play out from here…
After its rally at the end of 2022, XOM transitioned into a sideways pattern this year.
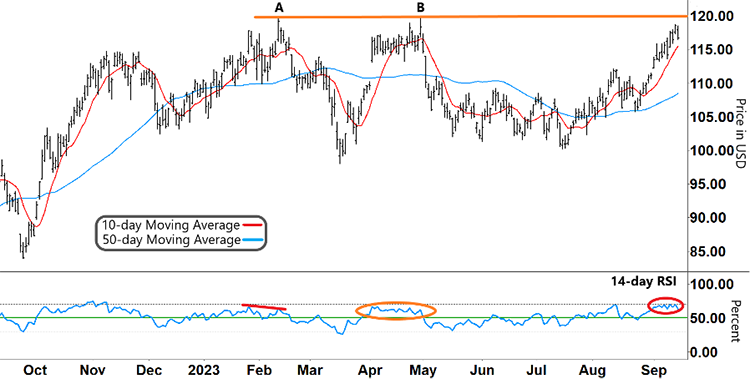
In the chart below, the long-term 50-day Moving Average (MA, blue line) is currently tracking around the same level as December of last year.
Exxon Mobil (XOM)
Source: eSignal
Within this overall rangebound pattern, though, there have been some sharp moves higher.
In February, we see that initial peak at ‘A’ just below $120. This is followed by another peak in late April at ‘B.’ Then there’s the recent run-up since July.
Each of these rallies coincided with the Relative Strength Index (RSI) breaking into its upper band (above the green line).
The 10-day MA (red line) breaking and rallying above the 50-day MA was another bullish signal.
But it’s the action around the orange line at $120 that I want to concentrate on today.
When XOM hit its peak at ‘A,’ the RSI reversed and made a lower high at the lower red line. It was a similar pattern to XOM’s peak last November.
That downward move from ‘A’ accelerated when the RSI fell back into its lower range.
Take another look:
Exxon Mobil (XOM)
Source: eSignal
But you’ll notice a different pattern when XOM peaked at ‘B.’
This time the RSI made a series of tight sideways zigzags (orange circle). Then it also dropped through support and pulled XOM lower.
Now, with XOM’s current rally, you can see a similar pattern to ‘B’ emerging with the RSI. Again, it is zigzagging sideways along overbought territory (upper gray dashed line).
And XOM is once again closing in on $120 – a level it has been unable to break through so far.
So what am I looking for next?
Free Trading Resources
Have you checked out Larry’s free trading resources on his website? It contains a full trading glossary to help kickstart your trading career – at zero cost to you. Just click here to check it out.
Even though the RSI tracked sideways in a zigzag pattern, XOM was still able to gently climb to its peak at ‘B.’
XOM only fell when the RSI retraced lower and started tracking in the bottom half of its range.
So XOM can still continue to climb if the current sideways RSI pattern persists. But we do need to watch out for the RSI turning lower…
Especially as XOM approaches an important level.
When XOM tried to break through $120 in February and April, it quickly reversed and lost around 20% in both cases.
If this pattern repeats and XOM is unable to break above $120, a clear fall in the RSI could provide the setup for a potential short trade.
Regards,
Larry Benedict
Editor, Trading With Larry Benedict
Are you watching XOM for a potential trade? Let us know at feedback@opportunistictrader.com
Reading Trading With Larry Benedict will allow you to take a look into the mind of one of the market’s greatest traders. You’ll be able to recognize and take advantage of trends in the market in no time.
