There’s no shortage of catalysts impacting the artificial intelligence (AI) trade.
We’ve seen surging capex spending across hyperscalers, accelerating AI adoption, and advances in AI that threaten to replace entire industries like software. Those are big tailwinds.
But at the same time, geopolitical events can rattle the entire stock market. We’ve seen that with the conflict in the Middle East and court rulings against President Trump’s tariff policies.
With this tug-of-war going on, volatility in AI stocks should be going through the roof. Yet something strange is happening…
Indexes leveraged to the AI trade and the ETFs tracking them are showing a surprising lack of price swings.
So what’s going on?
The truth is, it may look calm on the surface so far, but conditions could soon deliver a burst of the expected volatility.
Let’s look at the key levels to detect the arrival of a major expansion in AI stock volatility…
The Invesco QQQ Trust, Series 1 (QQQ) tracks the Nasdaq-100, and it is dominated by AI stocks.
The top 10 holdings in QQQ include companies like Nvidia (NVDA), Apple (AAPL), and Microsoft (MSFT). In fact, every top 10 stock is exposed to the AI ecosystem in some way. By some estimates, 65% of QQQ is driven by AI exposure.
And judging by the price action in QQQ, the AI trade went cold nearly five months ago.
That’s when QQQ last made a high at the end of October. Since then, QQQ has been drifting sideways. Here’s the QQQ chart below:
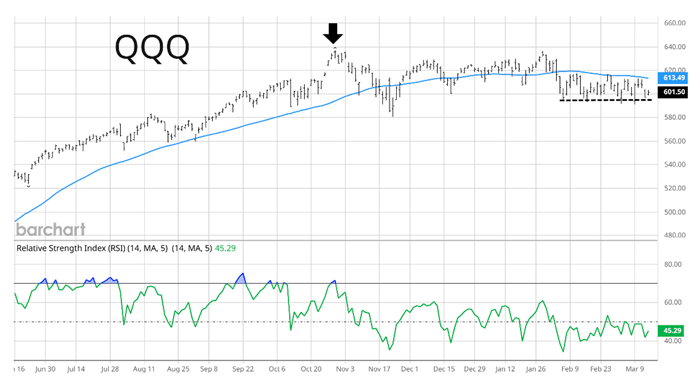
You can see the peak in QQQ at the arrow. Since then, QQQ has been stuck trading in a relatively tight range.
At the start of February, QQQ fell below the 50-day moving average (MA – blue line), and it has not been able to recapture that level.
But QQQ’s price is also refusing to make a downside break below the $595 level, which it has tested several times since early February (dashed line).
Given everything happening in the AI trade and the geopolitical uncertainty present, the lack of price movement is remarkable.
But the calm might not last much longer. A breakout in volatility is on the way…
Amid the Supreme Court’s ruling on President Trump’s tariffs, AI’s existential threat to software stocks, and now the conflict erupting in the Middle East, QQQ’s trading range is growing even tighter.
But key “make or break” levels are coming into play. At the same time, one measure of volatility is being squeezed, which often happens before a bigger move.
Take another look at the QQQ chart:
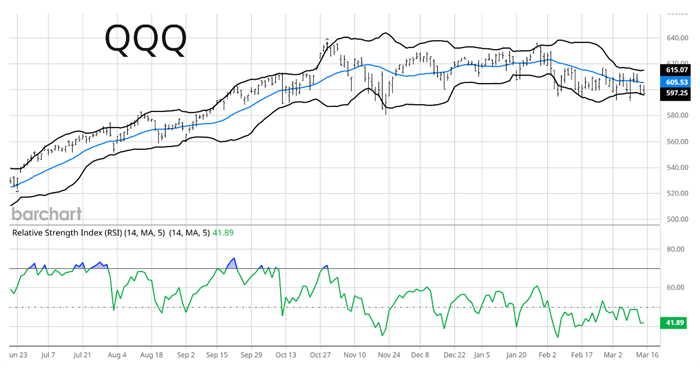
One way to visualize tight price action is with Bollinger Bands. They plot the volatility in price around a moving average (20-day MA in this case). The bands are the black lines plotted around QQQ’s price.
When the bands narrow, that shows volatility is being compressed. A tight Bollinger Band often precedes an expansion in the bands, which indicates higher volatility.
Despite everything happening across the stock market and AI catalysts, QQQ’s bands are now extremely tight, which points to the low volatility in recent price action.
That makes the recent range on QQQ more important. On the upside, watch for QQQ to break above the $620 level, which would also recapture the 50-day MA. On the downside, the $595 level is key.
On a break of either level, look for an expansion in the Bollinger Bands to indicate a big move could be underway.
As a trader, identifying key price levels, having a plan, and waiting to react is how to stay objective during times of uncertainty.
Happy Trading,
Larry Benedict
Editor, Trading With Larry Benedict
Reading Trading With Larry Benedict will allow you to take a look into the mind of one of the market’s greatest traders. You’ll be able to recognize and take advantage of trends in the market in no time.
