Larry’s Note: I’ve been two steps ahead of the Federal Reserve for years.
I accurately predicted the rate hikes in 2022… and the rate pause at the start of this year. In both cases, I helped my followers beat the market by double-digits.
That’s why I want to put you on alert right now… If you act before the September 17 Fed meeting, I believe you have a shot at some of the biggest gains of your life.
I’ll share all the details – including the ticker you’ll want to trade – at my Fed Decision Advance Warning event on Wednesday, September 10, at 8 p.m. ET.
Please plan to join me then. You can RSVP with one click right here.
Stock market volatility might seem nonexistent.
But sometimes, volatility shows up first in places you least expect…
Like the $145 trillion global fixed-income market, which easily dwarfs the global value of stocks.
Bonds are supposed to offer protection for investors and experience smaller price swings than stocks. So when bond market volatility picks up, you need to pay attention.
Right now, fears over the job market, the outlook for rate cuts, and inflation concerns could rock the bond market and spill into stocks… just like many times before.
With this in mind, there’s one little-known metric tracking bond volatility that you need to watch.
Its recent jump could spell trouble for the stock market…
The term volatility is used to describe the magnitude of price swings. Higher volatility means more and bigger ups and downs.
The CBOE Volatility Index (VIX) is often referred to as Wall Street’s “fear gauge” because it tends to jump when stocks are selling off.
But the bond market has its own volatility measure…
The Merrill Lynch Option Volatility Estimate tracks volatility in U.S. Treasury securities. That name is a mouthful, though, so traders refer to it as the MOVE Index.
Similar to the VIX, the MOVE Index can see sharp changes in both directions. Here’s a chart of the MOVE Index going back three years:
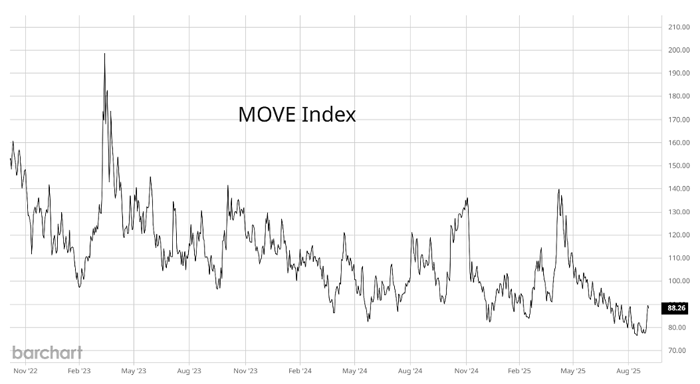
A move higher points to volatility in Treasurys picking up. A mean-reverting move lower usually follows.
Similar to stocks, the MOVE Index tends to jump when Treasurys are selling off.
But sometimes, the MOVE Index will start to change direction before it’s apparent that volatility is picking up.
Sudden spikes can be a warning of incoming volatility… for bonds and stocks alike.
That’s why you need to pay attention to an important signal that just triggered on the MOVE Index…
|
Tune in to Trading With Larry Live
Each week, Market Wizard Larry Benedict goes live to share his thoughts on what’s impacting the markets. Whether you’re a novice or expert trader, you won’t want to miss Larry’s insights and analysis. Even better, it’s free to watch. Simply visit us on YouTube at 8:30 a.m. ET, Monday through Thursday, to catch the latest. |
A sudden jump higher in the MOVE Index can point to rumblings in the bond market.
Given the massive size of the global bond market, rising volatility can spill into other areas of the financial markets as well.
One simple method for tracking a change in volatility is to plot the MOVE Index along with its 50-day moving average (MA). Here’s the chart below:
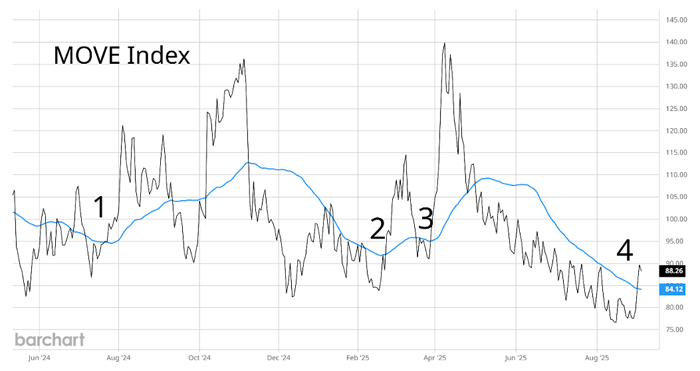
The blue line is the 50-day MA. You should pay close attention to when the MOVE Index makes a cross above the 50-day from a low level.
That marks a change in bond market volatility and has frequently pointed to troubles ahead for the stock market as well.
Take a look at the numbers I labeled on the chart, highlighting a few crossover events from the past year.
“1” marked the start of a sell-off last summer that saw the S&P 500 lose 5% in just seven trading days.
“2” occurred on February 25, only a few days after the S&P 500 peaked as trade war headlines intensified.
“3” marked the sharp stock market sell-off into the early April lows, with the S&P 500 losing nearly 11%.
And now we have a new cross above the 50-day at “4.”
Not every crossover event produces a negative market shock, of course. But this signal is meaningful often enough that it’s worth sitting up and paying attention when it happens.
After all, we have no shortage of catalysts that could see volatility spill into the stock market. Growing weakness in the labor market, pressure on the Fed to cut interest rates, stubbornly high inflation…
And we’re edging ever closer to the Fed’s next meeting, when the market expects its first rate cut.
The dominoes are lining up. Bond volatility is on the rise…
Stock market investors should be on notice.
Happy Trading,
Larry Benedict
Editor, Trading With Larry Benedict
|
Free Trading Resources Have you checked out Larry’s free trading resources on his website? It contains a full trading glossary to help kickstart your trading career – at zero cost to you. Just click here to check it out. |
Reading Trading With Larry Benedict will allow you to take a look into the mind of one of the market’s greatest traders. You’ll be able to recognize and take advantage of trends in the market in no time.
