|
Larry’s note: Welcome to Trading with Larry Benedict, the brand new free daily eletter, designed and written to help you make sense of today’s markets. I’m glad you can join us. My name is Larry Benedict. I’ve been trading the markets for over 30 years. I got my start in 1984, working in the Chicago Board Options Exchange. From there, I moved on to manage my own $800 million hedge fund, where I had 20 profitable years in a row. But these days, rather than just trading for billionaires, I spend a large part of my time helping regular investors make money from the markets. My goal with these essays is to give you insight on the most interesting areas of the market for traders right now. Let’s get right into it… |
It’s no surprise that the most popular sectors of the market tend to be those where investors see the best opportunity to profit.
Investors flock to tech stocks and cryptos in hopes of securing big profits.
But sometimes, trading opportunities can arise in some of the least exciting parts of the market… like the utilities sector.
For most traders, the utilities sector is just not on their radar. For them, it’s best left for income investors wanting to collect regular dividends.
But as we’ll see today, the utilities sector can provide plenty of trading opportunities…
One way I monitor the utilities sector is through the Utilities Select SPDR Fund (XLU).
To check out XLU’s recent price action, let’s pull up the chart…
XLU Price Chart
Source: eSignal
As the chart shows, the XLU share price certainly moves around!
From early March to mid-April, XLU rallied around 17%. And from July to August, it rallied 11%…
That’s more than enough to generate some nice, tidy profits.
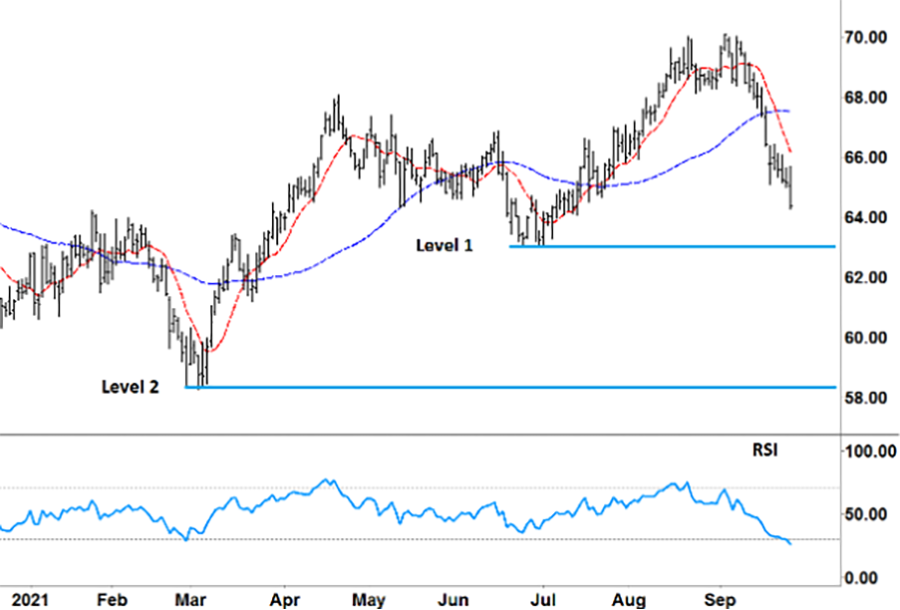
After topping out in September, though, XLU is coming back down to Earth. Since the start of this month, the share price has already fallen 8.5%.
The 10-day moving average (red dashed line) crossing down over the 50-day MA (blue dashed line) confirms XLU is in a downtrend… for now.
If this continues, XLU will soon test its first important level: level one ($63) – the upper blue horizontal line on the chart.
XLU formed this support level between late June and early July. After failing to break down through this level multiple times, XLU instead turned around and rallied to its September high.
So, I’ll be watching to see if XLU tests this level again over the coming week.
As usual, I’ll be keeping an eye on the Relative Strength Indicator (RSI) as well.
That’s the bottom half of the chart. So, let’s take another look below…
XLU Price Chart
For the first time since March, the RSI has gone into oversold territory (below the lower grey dotted line). When this happened, the RSI formed a ‘V’ shortly before XLU rallied 17%.
If XLU holds the support at level one, and the RSI forms a new ‘V’, that could provide a good opportunity to enter a long trade.
However, if XLU fails to hold the support, that brings a much bigger potential down move into play…
The next test of support is level two ($58.25) – the lower blue horizontal line. This goes back to XLU’s March low.
Holding this level becomes even more critical for XLU. If XLU breaks below level two, that could be the start of yet another big move lower…
Right now, though, we’ll have to wait and see.
There is a lot that needs to happen before level two comes into the picture. We’ll start by watching level one over the coming week.
For one of the most highly regulated sectors, XLU can certainly throw up some great trading opportunities.
As the chart shows, XLU has had three strong moves in just the last six months alone. It’s the exact type of market that can really help build your trading account… and confidence.
And, while other traders get sucked into high-risk, low probability trades, XLU shows that you can generate profits in some of the most unlikely sectors of the market.
Regards,
Larry Benedict
Editor, Trading With Larry Benedict
P.S. We’re excited to hear what you think of your new eletter, Trading With Larry Benedict. Let us know at feedback@opportunistictrader.com.
Reading Trading With Larry Benedict will allow you to take a look into the mind of one of the market’s greatest traders. You’ll be able to recognize and take advantage of trends in the market in no time.
