Larry’s Note: The market is getting choppier…
The Roundhill Magnificent Seven ETF (MAGS), which follows the performance of the Magnificent 7 stocks, is almost in a bear market. It’s down 19% from the high in October.
That scares many “buy and hold” investors, who’ve gotten used to buying the dips and seeing quick gains. But the bull market that rewarded their buying is in the rear-view mirror. To thrive in today’s market, you need a strategy that keeps you nimble. And you need to keep your risk management tight.
Those are both things I discussed during my AI Chaos to Cash briefing last week. With this options strategy, you know exactly what you’re risking… and you’re out of each trade by 4 p.m. ET that day.
No more wondering what headlines are going to hit overnight. No more tossing and turning, hoping for the best.
If you haven’t checked out this strategy yet, please make sure you do so soon. This replay won’t be online much longer… Watch it here right now.
The war in the Middle East is breaking traditional correlations.
Bonds often rally when stocks are selling off. Precious metals also see demand during uncertain times caused by geopolitical conflicts.
But stocks have been selling off since the start of the month, and bonds and gold prices are dropping alongside them.
At the same time, one key correlation has remained intact…
Throughout the last couple of years, Bitcoin has been a reliable leading indicator of the investor mood… often changing direction before we see a reaction in the stock market. Yet its recent price action has been flying under the radar ever since war broke out in the Middle East.
Now Bitcoin is forming an ominous pattern that suggests the sell-off in stocks isn’t done yet.
Let’s take a look at the setup you need to watch right now…
Supporters of Bitcoin tout crypto as a “store of value” or as a superior method for facilitating financial transactions.
But to me, Bitcoin’s best utility is as a leading indicator for risk assets – especially speculative areas of the market, like artificial intelligence (AI) and tech stocks.
Bitcoin peaked in early October, a couple of weeks before the tech- and AI-heavy Nasdaq-100 saw its top. More recently, it created a bearish chart pattern (along with a failed breakout) that warned of trouble for stock prices well before the war with Iran began.
Take a look at the Bitcoin chart below.
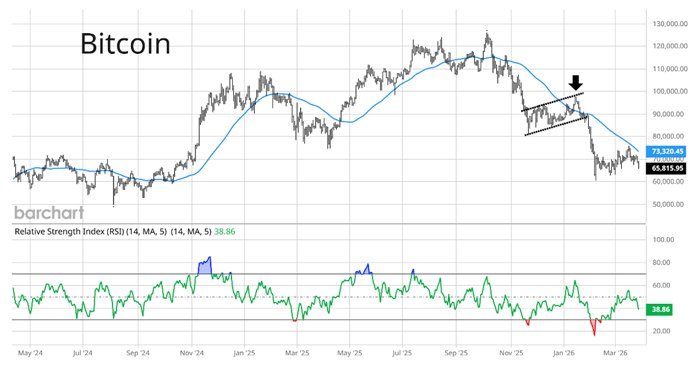
Following a steep decline into late November, Bitcoin created a pattern called a “flag,” shown with the dashed lines. It’s a bearish flag in this case because the pattern is upward sloping and formed within an overall downtrend.
After a failed breakout over the 50-day moving average (MA – blue line) at the arrow, Bitcoin broke down from the flag pattern in late January.
A sharp drop followed, taking the crypto to the $60,000 level. That was a key support level not seen since heading into November 2024’s elections.
Vitally, that breakdown warned of souring investor risk appetite well before the U.S. started a war with Iran and the Nasdaq fell to its lowest level in over six months.
Bitcoin stabilized at a critical level… but is now creating the same bearish pattern again.
Bitcoin’s plunge to the $60,000 level in early February created some of the most oversold conditions ever seen in the crypto’s history.
At one point, Bitcoin was trading 30% below its 50-day MA. The Relative Strength Index (RSI) hit the second-most oversold level ever seen in Bitcoin. That helped spark a relief rally.
But now a pattern is forming that’s eerily similar to the bear flag seen in late January. Take another look at the chart:
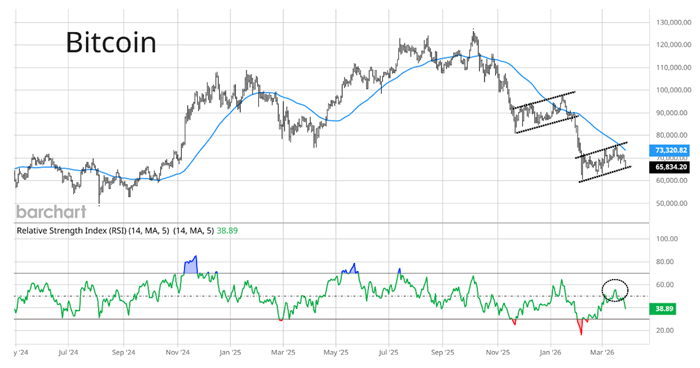
Another bear flag pattern is shown with the second set of dashed lines, while resistance levels are also coming into play.
The move off $60,000 saw Bitcoin test the 50-day from below, while the RSI rose toward the 60 level at the circle. (The 60 level on RSI will often serve as an overbought level during a downtrend.)
Those are important resistance levels to keep in mind. The next thing to watch is if the price breaks down out of the flag pattern.
That would point the way to another retest of $60,000… and possibly another breakdown through that key support level.
Given the correlation between Bitcoin and risk assets, another Bitcoin breakdown could spell more trouble ahead for the Nasdaq-100 and the AI stocks that dominate it…
Happy Trading,
Larry Benedict
Editor, Trading With Larry Benedict
Reading Trading With Larry Benedict will allow you to take a look into the mind of one of the market’s greatest traders. You’ll be able to recognize and take advantage of trends in the market in no time.
