Larry’s Note: Every quarter, the CEOs of America’s biggest companies are legally required to get on phone calls and answer questions from Wall Street analysts. Anyone can listen. But almost nobody knows what to listen for.
That is why I hope you accept this invitation to my Wall Street Money Calls broadcast on Wednesday, February 11, at 8 p.m. ET.
There, I’ll walk you through how eight signals can help point you to gains that could put thousands of dollars into your pockets. In fact, I’ve already identified a potential 255% opportunity in the coming days.
So I hope you’ll join me for this broadcast. To RSVP, simply click right here to automatically add your name to the attendee list.
Volatility is creeping back into the market.
It started with a historic rout in precious metals following hawkish developments at the Federal Reserve.
When the Fed elected to keep interest rates on hold last week, it softened concerns about the labor market and described the economy as expanding at a “solid pace.”
President Trump also nominated Kevin Warsh to lead the central bank once current chair Jerome Powell’s term ends. Warsh is known for his hawkish views in the past and his frequent criticism of the Fed’s balance sheet.
As the outlook for rate cuts grows uncertain, volatility is picking up. Last week, gold saw its worst daily decline since the early 1980s. Silver prices dipped more than 30% on an intraday basis.
The downside isn’t limited to precious metals. Stock indexes are under pressure as hyped artificial intelligence stocks like Oracle and Microsoft are now 54% and 23% off their highs, respectively.
But there’s another area of the market you need to keep a close eye on. If it’s the next target for volatility, you could feel it throughout your portfolio…
The size of the global bond market stands at $145 trillion, which is even higher than the global value of stocks.
Bonds are often viewed as less volatile than stocks and serve as a cornerstone of retirement portfolios. Fixed income is supposed to offer a diversification benefit to stocks. And historically, it has provided protection when the stock market pulls back. That’s especially the case for fixed-income securities issued by governments with high-quality credit ratings.
But things don’t always go according to plan. Sometimes, bonds sell off alongside stocks, and when they do, the results can be devastating.
That’s what happened during the last bear market in 2022. While the S&P 500 fell as much as 25% on the year, bond yields surged higher… and bond prices dropped.
The 30-year Treasury yield went from 1.91% at the start of 2022 to as high as 4.38% during that year. A benchmark of bond prices fell by 13% on the year, which was the worst annual return on record. Likewise, the popular “60/40” retirement portfolio consisting of 60% stocks and 40% bonds had one of its worst years ever.
I’m pointing this out because another round of bond market volatility could be on the horizon.
We’re already seeing signs of trouble in key markets around the world. And now one chart is tipping that the U.S. could be next.
Here are the levels on bonds that you need to watch closely…
Key bond markets around the world are selling off as yields rise.
Japan’s 10-year government bond yield jumped to its highest level ever last month. Just this week, Germany’s 30-year government bond yield touched its highest level since 2011.
So far, the U.S. has been spared from a sharp rise in long-term interest rates. But trouble in the charts is brewing.
I recently showed you a pattern to track on the 30-year Treasury yield. If that pattern completes, we could see a sharp rise in long-term U.S. rates.
The iShares 20+ Year Treasury Bond ETF (TLT) tracks bond prices on the longer end of the Treasury yield curve. When long-term yields are rising, TLT typically pulls back.
And TLT is testing a key support level in a pattern going back several years. Here’s the chart below.
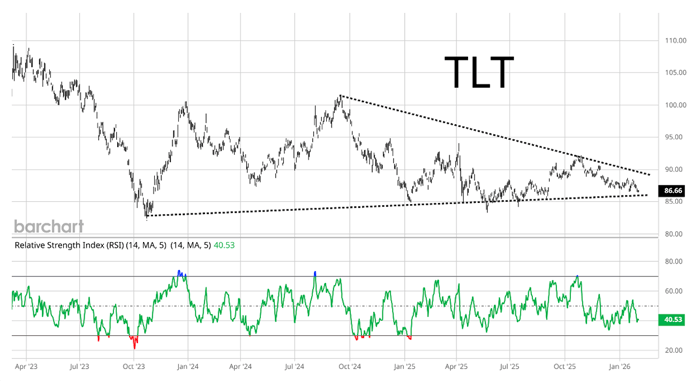
TLT is once again testing trendline support at the same time that the 30-year yield is forming a breakout pattern.
Completing these patterns could signal that rising long-term rates are headed for the U.S. That could spark a sell-off in bond prices.
While many investors are fixated on short-term rates at the moment, we can’t afford to be too short-sighted.
Volatility in longer-term bonds could be about to drag down investor portfolios just like it has in the past.
But rest assured, as traders, we’ll look for opportunity in these moves. In 2022, I handed my Opportunistic Trader subscribers a 44.8% return on cash while the stock and bond markets tumbled. And I’m keeping a close eye on similar opportunities for the year ahead…
Happy Trading,
Larry Benedict
Editor, Trading With Larry Benedict
Reading Trading With Larry Benedict will allow you to take a look into the mind of one of the market’s greatest traders. You’ll be able to recognize and take advantage of trends in the market in no time.
