By Larry Benedict, editor, Trading With Larry Benedict
After reaching its all-time high in late 2021, NXP Semiconductors’ (NXPI) fortunes reversed sharply in 2022…
It dropped 45% in the space of 10 months.
NXPI enjoyed a much more promising start to 2023 – yet that price action has been unable to follow through.
Dwindling buying momentum instead saw NXPI drift lower.
So with recent signs that momentum could be shifting, I want to see what’s on NXPI’s horizon…
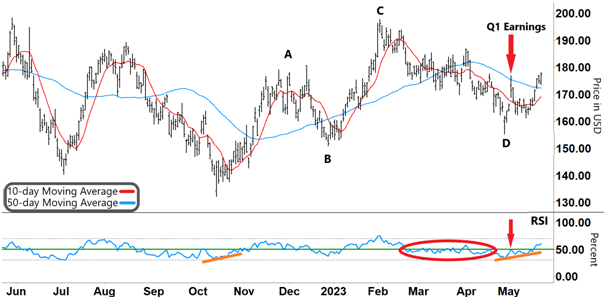
On the chart of NXPI below, you can see where it bottomed out in October last year.
Then as buying momentum returned, NXPI was able to build a base to rally. We can see that increase in momentum in the left orange line in the Relative Strength Index (RSI)…
NXP Semiconductors (NXPI)
Source: e-Signal
From there, NXPI began to build into a promising bullish pattern.
After rising to ‘A,’ NXPI topped out when momentum reversed. NXPI then made a higher low at ‘B’ (compared to October’s low).
Then, the RSI rallied and broke into the upper half of its range. And NXPI made a higher high at ‘C.’
Again, a reversal of momentum saw NXPI top out…
The RSI formed an inverse ‘V’ from overbought territory (upper grey dashed line). NXPI then began to fall as the RSI steadily trended lower.
Yet the down leg to the higher low at ‘D’ took far longer than the previous pullback from ‘A’ to ‘B.’
That was due to the action of the RSI…
As you can see inside the red oval, the RSI remained stuck for an extended period just below resistance (green line).
Take another look:
NXP Semiconductors (NXPI)
Source: e-Signal
Even when NXPI initially bounced off its Q1 earnings results (upper red arrow), the RSI was still unable to break through resistance (lower red arrow).
Recently, though, you can see a clear upswing in momentum…
The right orange line shows the RSI trending higher – and it recently broke up through resistance.
And that’s not the only bullish signal…
With NXPI trading above its 50-day Moving Average (MA, blue line), the 10-day MA (red line) could soon also cross above it.
So what can we expect from here?
|
Free Trading Resources Have you checked out Larry’s free trading resources on his website? It contains a full trading glossary to help kickstart your trading career – at zero cost to you. Just click here to check it out. |
Although NXPI shows promise, we’ll need to see several signals for the next up leg to develop further…
For a start, the RSI has only just broken into its upper range. So it will need to gain some traction. The longer the RSI remains in its upper half, then the stronger NXPI’s rally will be.
The other thing I’m watching is our two MAs…
As the chart shows, they are converging. We’ll now want to see the 10-day MA cross above the 50-day MA and accelerate higher (with the 50-day MA also beginning to move higher). That will give us further confirmation of NXPI’s rally.
Longer term, for NXPI’s rally to remain intact, it will need to make a higher high compared to ‘C.’
Regards,
Larry Benedict
Editor, Trading With Larry Benedict
Do you think NXPI will sustain a long-term rally? Send in your thoughts to feedback@opportunistictrader.com.
Reading Trading With Larry Benedict will allow you to take a look into the mind of one of the market’s greatest traders. You’ll be able to recognize and take advantage of trends in the market in no time.
