It has been a great start to the year for Big Tech…
Stocks like Apple (AAPL), Microsoft (MSFT), and Meta Platforms (META) have all rallied strongly. They are up around 40%, 45%, and 120%, respectively, since the start of the year.
However, I want to check on another mega-cap tech stock today…
Despite starting 2023 more sluggishly than the others, Alphabet (GOOGL) has rallied a massive 43% since March…
That includes a 20% burst higher in the last three weeks alone.
But after such a dramatic move higher, GOOGL is now showing signs of overheating.
That’s why I want to see how things might play out from here…
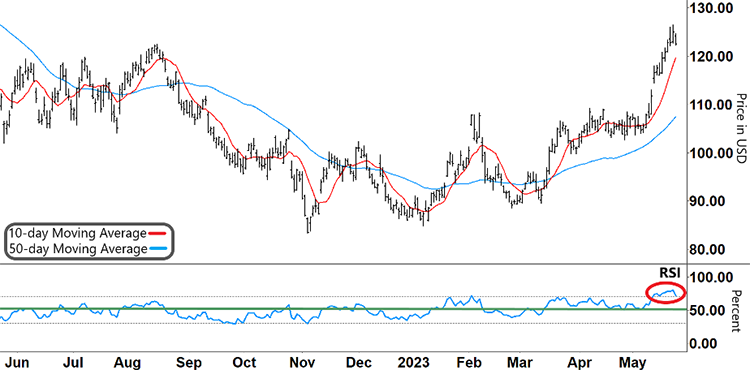
In the GOOGL chart below, the 50-day Moving Average (MA, blue line) shows its long-term trend.
It trended lower through the end of last year before rolling over and rallying higher…
Alphabet (GOOGL)
Source: eSignal
Despite the broader pattern shown by the 50-day MA, the shorter-term 10-day MA (red line) shows us that there have been plenty of swings along the way…
The 10-day MA has crossed the 50-day MA nine times since June last year.
The action since the most recent crossover in March, though, shows the strength of GOOGL’s current rally…
After the 10-day MA crossed above the 50-day MA, it briefly flatlined in April before rising almost vertically.
As the chart shows, the 10-day MA’s sharp rise also dragged the 50-day MA higher.
The chart also shows the action of our momentum indicator, the Relative Strength Index (RSI)…
When GOOGL was falling on the left-hand side of the chart, the RSI remained mainly bearishly in the bottom half of its range.
That is what you’d expect… Without sustained positive momentum, a stock is going to fall.
And it’s the opposite when a stock is rallying…
Apart from a brief pullback in March, the RSI has remained bullishly in its upper band throughout GOOGL’s strong rally.
However, as you can see (red circle), GOOGL’s recent surge has put the RSI well into overbought territory (upper grey dashed line).
Take another look:
Alphabet (GOOGL)
Source: eSignal
The action the RSI takes next will be crucial to GOOGL’s direction from here.
So what am I looking for?
Free Trading Resources
Have you checked out Larry’s free trading resources on his website? It contains a full trading glossary to help kickstart your trading career – at zero cost to you. Just click here to check it out.
Just because the RSI goes into overbought territory, it doesn’t guarantee that a stock will fall…
After all, it’s not uncommon for the RSI to track along or near overbought territory when a stock is rallying strongly.
What I do look out for, though, is a clear reversal pattern from the RSI…
The RSI in the chart above has already made an inverse ‘V.’ And the RSI tracking lower from here could show that traders who got in on GOOGL’s move are locking in their profits.
It could also cause recent GOOGL buyers to quickly abandon their positions, adding more selling pressure.
A move from the RSI back to support (green line) could potentially see GOOGL trade between the $115–120 range.
Longer term, the RSI breaking below support could then be the start of a bigger move down.
Larry Benedict
Editor, Trading With Larry Benedict
Where do you think tech will go from here? Send in your thoughts to feedback@opportunistictrader.com.
Reading Trading With Larry Benedict will allow you to take a look into the mind of one of the market’s greatest traders. You’ll be able to recognize and take advantage of trends in the market in no time.
