Volatility can jump out of nowhere, even in safe-haven assets.
Gold was in the middle of an epic run. Prices topped at just under the $4,400 level. At one point, gold prices were up as much as 67% on the year. That’s the best showing since 1979.
There has been no shortage of catalysts working in gold’s favor.
The U.S. dollar is having a historically weak year, which is driving investors into other stores of value.
Debt levels and deficit spending are running out of control, with deficits projected to top $22 trillion over the next decade.
And just like any tradable asset, gold prices are susceptible to the emotional pull of greed during booms, which can lead new buyers to pile in.
But now a sudden plunge in gold prices could be ushering in a new period of volatility in gold.
You might think that’s a bad thing… but in fact, it’s great news for traders…
After peaking near $4,400 per ounce, gold prices are down 7.5%. That includes a single-day loss of over 6%, which is the largest drop in 12 years.
On a per-ounce basis, gold shed nearly $250 in one trading session. That’s the biggest wipeout in gold’s history.
But the jump in volatility wasn’t without warning.
You may have heard of the CBOE Volatility Index (VIX). It tracks expected volatility for the S&P 500, and it is often referred to as Wall Street’s “fear gauge” because it tends to spike higher when stocks are selling off.
Gold has its own volatility measure, which has been steadily moving higher since bottoming in February 2024. Here’s the chart below:
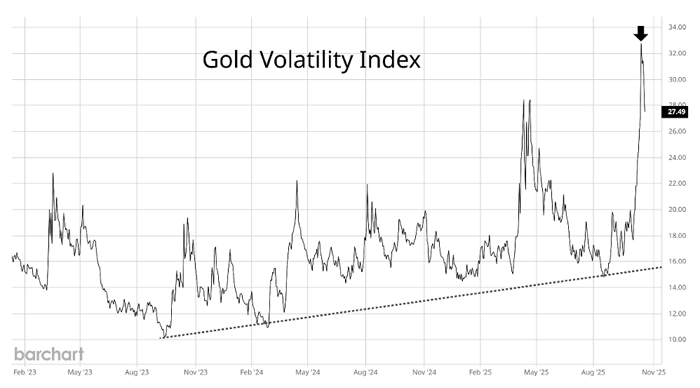
The trendline shows the increase in gold’s expected volatility. You can see the massive spike higher since the start of October, heading into gold’s pullback (the arrow).
Volatility levels on gold jumped through the roof. That took volatility to the highest level since the pandemic in 2020.
Extreme price swings might scare investors who want to hold gold for the long run and are forced to sit through a roller coaster ride.
But for traders, the sudden burst of volatility means profit opportunities in the making.
The more extended gold became to the upside, the larger the reversal in the making. And that’s exactly what we’re seeing with gold’s mean-reverting move lower.
At one point, gold prices were trading 18% above their 50-day moving average (MA). That’s about the most extended gold has been over the 50-day MA in the past 15 years (see the chart below).
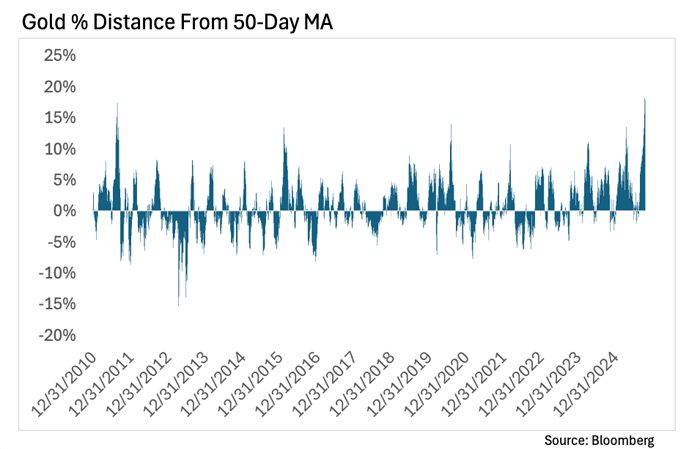
The Relative Strength Index (RSI) was also extended.
The RSI measures underlying price momentum. It hit 87 last week. That’s the highest level since 2020. The weekly RSI rose to 85, which is the highest level in over 20 years.
In the past, extreme RSI readings led to a volatile period of sideways trading action in the months that followed.
For traders, that’s a dream environment.
As long-time readers know, I’m a mean-reversion trader. That means I hunt for situations where prices get overextended. That way, we can profit when things turn the other direction.
So these types of whipsaws back and forth can hand us more and more chances to profit as prices reverse.
And if you want to see one of my favorite ways to profit from the upcoming volatility, you can check out my recent presentation. I covered some key opportunities in the commodity space where we can be poised to strike – including the chance to get a special report on the gold trade setup.
Happy Trading,
Larry Benedict
Editor, Trading With Larry Benedict
Reading Trading With Larry Benedict will allow you to take a look into the mind of one of the market’s greatest traders. You’ll be able to recognize and take advantage of trends in the market in no time.
