Over two weeks ago, we took a close look at gold.
Runaway inflation and war in Ukraine had initially spurred the VanEck Gold Miners ETF (GDX) to rally around 45% from late January through April.
However, after peaking on April 18, GDX reversed sharply.
In less than a month, GDX gave up all its gains for the year. And it’s been stuck in a downtrend ever since.
But when we looked at GDX on August 29, it was about to test a key level.
Today, we’ll see how that move panned out… and what it’ll take for gold to break its losing streak.
Let’s take a look at the GDX chart below…
VanEck Gold Miners ETF (GDX)
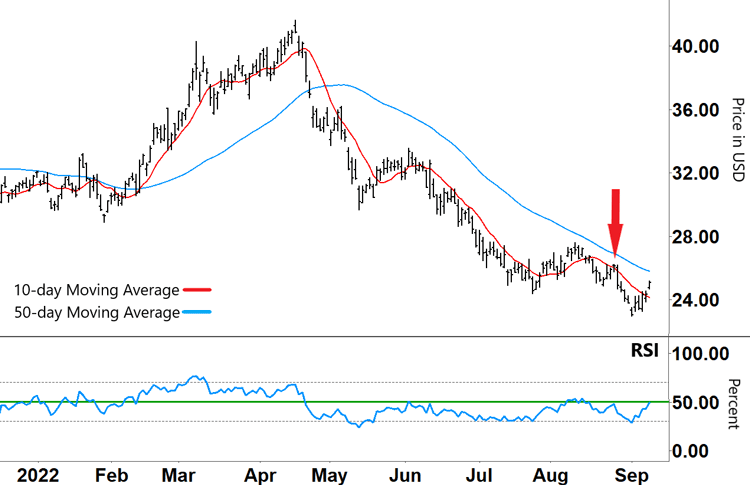
Source: e-Signal
After rising from February through April, the 50-day moving average (MA – blue line) shows GDX’s long-term trend has been steadily sliding down.
That downtrend kicked off when the Relative Strength Index (RSI) reversed from overbought territory (upper grey dashed line).
And the 10-day MA (red line) breaking below the 50-day MA confirmed the downtrend…
The 10-day MA has been bearishly tracking below the 50-day MA for the entirety of GDX’s down move. And apart from a brief period in August, the RSI has been tracking below support (green line).
When we last checked in on GDX (red arrow on the chart), the RSI was closing in on resistance, and we were looking for two signals that would see GDX rally higher…
The RSI breaking above resistance would set GDX up for a potential move higher.
The 10-day MA breaking back above the 50-day MA would then add further confirmation of an emerging uptrend.
But that move failed to play out…
VanEck Gold Miners ETF (GDX)
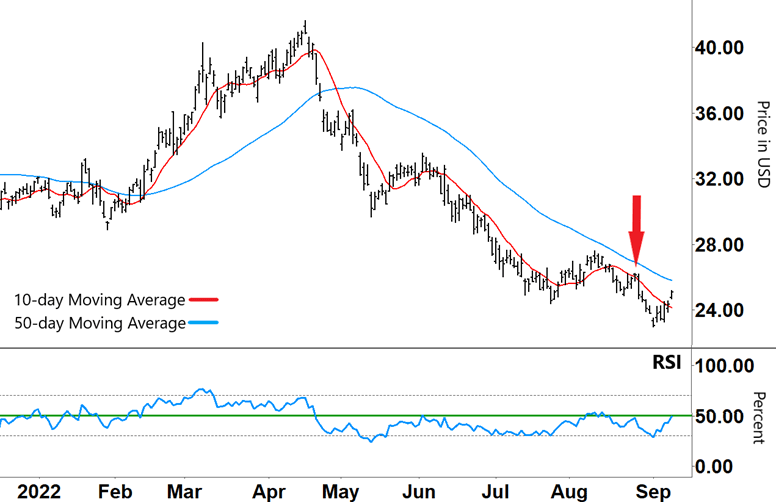
Source: e-Signal
Instead, the RSI failed to break through resistance and reversed downward, dragging GDX’s price lower in the process. This put the RSI into oversold territory (lower grey dashed line).
As the RSI formed a ‘V’ and rallied higher from oversold territory, GDX also rallied off its lows.
The RSI is right back on resistance – a hurdle it was unable to surpass recently.
So where is gold headed now?
Free Trading Resources
Have you checked out Larry’s free trading resources on his website? It contains a full trading glossary to help kickstart your trading career – at zero cost to you. Just click here to check it out.
What happens with the RSI from here will have a major impact on GDX’s direction.
If the RSI breaks through resistance and gains traction in the upper half of its band – then the bounce off GDX’s lows could transform into a sustained rally.
And if the 10-day MA breaks above the 50-day MA, it would further confirm an uptrend.
With inflation running at multi-decade highs and GDX trading at two-and-a-half year lows – a breakout could transform into a robust rally.
But as always, we’ll let the chart dictate our trading strategy.
If the RSI again fails to break resistance and instead rebounds lower, then GDX’s current bounce will quickly lose momentum.
A prolonged stay in the lower half of the RSI’s band will then see GDX’s long-term downtrend continue.
Regards,
Larry Benedict
Editor, Trading With Larry Benedict
Do you think we’ll see a gold rally in the coming weeks?
Let us know at feedback@opportunistictrader.com.
Reading Trading With Larry Benedict will allow you to take a look into the mind of one of the market’s greatest traders. You’ll be able to recognize and take advantage of trends in the market in no time.
