Very specific days offer traders the potential for outsized gains.
On those days, the government releases big economic data… like inflation data and jobs reports. Or the Fed announces interest rate changes.
Each of these data releases – all 32 of them this year – has the potential to send a shockwave through the market…
And enable seasoned pros to trade for far bigger and quicker gains than normal as a wave of extra volume and volatility sweeps through the market.
And these money shock days are moving the market around even more than normal lately.
For example, last Wednesday, I wrote about a recent “money shock” trade that I used to generate a massive 173.5% gain during one trading day for my subscribers.
Today, I want to share another trade we did that generated a 144.8% gain in a day…
Trading Against the Herd Mentality
One of the key planks of my trading strategy is mean reversion…
I look for stocks or indexes that overshoot in either direction… and aim to profit when they snap back.
This strategy was behind the trade I want to run through today.
In the chart of the S&P 500 Index ($SPX) below, you can see what I mean. With the market oversold coming into earnings season, better-than-expected earnings results soon had bulls clamouring to go long.
This rush of fresh buying saw the S&P 500 rally 16% in a little over a month…
S&P 500 Index (SPX)
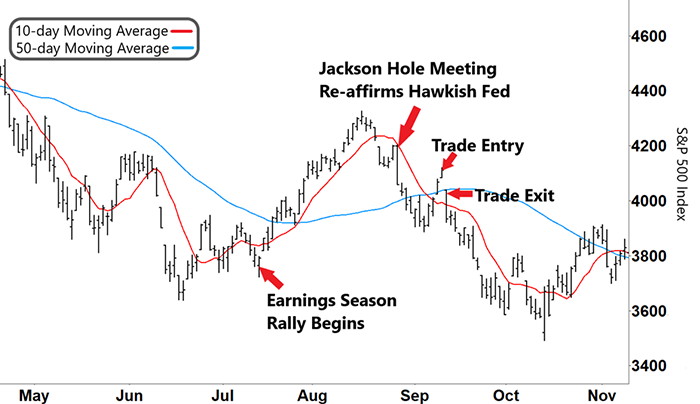
Source: eSignal
However, with the market overshooting to the upside, the S&P 500 peaked in mid-August and started selling down.
And just when the bulls thought the market was going to run again, the Fed held its meeting at Jackson Hole on August 26. There, the Fed reminded everyone that it wasn’t going to back down on rate rises.
You can see how quickly the market sold down.
Yet the market got bid up in early September again. And I knew that it was time to pounce…
Lower oil prices had lured buyers into thinking inflation was starting to wane… and the market rallied 7% in just four days.
Given this overshoot, it was the perfect setup to go short…
So, on September 12 (the day before inflation data was due), we bought a put option on the S&P 500. (Note that a put option increases in value when a stock or index falls.)
With inflation coming in higher than forecast the following day, it showed how the market once again got sucked into a false narrative…
And how quickly the rug can be pulled.
We closed out our position by selling our put option for a tidy 144% gain – all in less than 24 hours.
As always, I want to be clear that we generated this return by using options. Yet this trade example shows that by trading major economic releases, we can generate outsized returns.
Free Trading Resources
Have you checked out Larry’s free trading resources on his website? It contains a full trading glossary to help kickstart your trading career – at zero cost to you. Just click here to check it out.
The Next Money Shock Is Right Around the Corner
I have many examples that show just how much potential profit you can bank by trading these economic releases… I’ve made 89 successful trades like this just since the start of the bear market in January 2022.
I refer to these moments as “money shock” days because the market can move 20X more than usual when these data releases come out.
There are 32 of these days this year. And the next one is right around the corner.
That’s why I’ve created “The Money Shock Calendar” event to show exactly how I go about trading these days. It will happen on February 22 at 8 p.m. ET and is completely free to attend. All I ask is that you RSVP right here with one click.
If you’re interested in boosting your trading returns, then please set aside some time to join me.
I can’t wait to see you then…
Regards,
Larry Benedict
Editor, Trading With Larry Benedict