Over this past week, we’ve been looking at how “money shocks” can offer big opportunities to traders.
These money shocks occur on days when the government releases big economic data…
Like inflation and employment numbers… or other closely watched information like manufacturing data and interest rates.
Sometimes the smallest move in this data can have massive consequences for the market.
That gives seasoned pros the kind of trade setups and extraordinary gains that they just won’t see on other days. The good news for traders is that we’re seeing even bigger moves on these special days.
Yesterday and last week, we saw how money shocks helped us generate 173% and 144% gains in a single day by trading the S&P 500 Index.
Well, you don’t always have to trade an index to generate these outsized returns.
Today, I want to share how we ran a trade on tech behemoth Amazon (AMZN) instead…
On the chart below, AMZN started forming a base from May through June (red line)…
AMZN then began to rally in early July along with the broader market. Likewise, the Relative Strength Index (RSI) began to trend higher.
The market’s positive reaction to Q2 earnings results then saw Amazon’s stock gap higher in late July…
Amazon (AMZN)
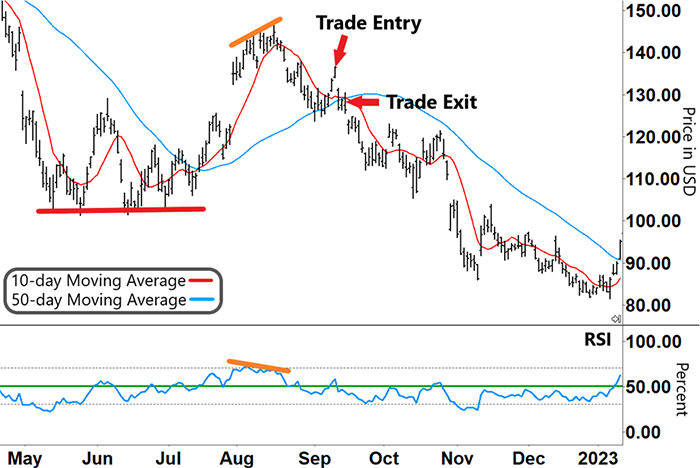
Source: eSignal
However, the diverging pattern between AMZN’s stock price (upper orange line) and the RSI (lower orange line) warned of a potential change in direction.
As the RSI continued to decline, AMZN rolled over and headed down.
But AMZN soon got pulled into a false narrative… People thought a lower oil price would lead to lower inflation. And by extension, people assumed that would mean a potential slowing of rate rises by the Fed.
That assumption saw AMZN rally strongly – gaining nearly 8% in just a few days.
AMZN’s chart pattern showed it was ripe for a reversal… But also, when inflation is running high, it puts pressure on the whole supply chain. That pinches retailers’ margins.
Even if that retailer is as big as AMZN.
The Fed had been very clear at the Jackson Hole summit just weeks before that it wasn’t going to go soft on raising rates… That meant a double whammy for retail stocks.
So when AMZN and the market rallied on September 12, we issued an alert to our subscribers to buy a put option on AMZN. (Note that put options typically increase in value when a stock or index falls.)
And as we anticipated, inflation data came in higher than anticipated on the following “money shock” day. And both AMZN and the broader market tanked.
AMZN trended lower over the next few days and traded back down around its weekly lows. So we closed out our position on September 15 by selling our put option for a 58.4% gain.
To be clear, we generated this return using options… But it shows the kind of potential gains these money shock days can hand traders that are ready for them… and have the right strategy.
|
Free Trading Resources Have you checked out Larry’s free trading resources on his website? It contains a full trading glossary to help kickstart your trading career – at zero cost to you. Just click here to check it out. |
The trades we’ve covered this past week (173%, 144%, and 58% gains respectively) were all generated from trading big economic releases – what I call “money shock” days…
The good news is that there are 32 of these special days this year…and that the next one is coming very soon. We’re just days away…
That’s why I’ve been preparing my “Money Shock Calendar” event, where I’ll share each of these 32 days. And I’ll explain the best ways to trade these kinds of days…
So if you’re interested in trading for these kinds of outsized returns, then I invite you to attend tomorrow night at 8 p.m. ET. All I ask is that you RSVP right here with one click.
I look forward to seeing you then…
Regards,
Larry Benedict
Editor, Trading With Larry Benedict
Reading Trading With Larry Benedict will allow you to take a look into the mind of one of the market’s greatest traders. You’ll be able to recognize and take advantage of trends in the market in no time.
