Managing Editor’s Note: Using a special type of AI, our colleague, tech investing legend Jeff Brown, has discovered a pattern that he says could help you make six figures in 60 days or less… over and over again… no matter what’s happening in the crypto market.
You can get all the details during his strategy session on Thursday, November 20, at 8 p.m. ET. Go here to RSVP with one click.
Warren Buffett is “going quiet.”
The “Oracle of Omaha” recently penned his last annual letter to shareholders as CEO of Berkshire Hathaway. He’s stepping down at the end of the year.
That follows a career spanning 60 years, where Buffett built Berkshire Hathaway into a sprawling $1 trillion empire.
His blueprint for building wealth was a long-term approach to value investing.
But the brilliance of Buffett is that he knew how to take advantage of volatility… just like other great traders.
Some of Buffett’s biggest scores came during times of outright panic. He used the 2008 Financial Crisis to collect a massive profit in Goldman Sachs. And the plunge in oil prices during the pandemic helped him make a large trade in Chevron.
Of course, while Buffett announced that he is going quiet, that may not last for very long.
He could be tempted out of retirement by the volatility heading our way… because Buffett’s own namesake indicator is sounding the alarm…
Stock market valuations are being pushed into the stratosphere.
Using expected earnings over the next 12 months, the S&P 500’s price-to-earnings ratio sits at 22.9. That’s about 34% higher than the 30-year average.
And valuations are reaching levels never seen before on the Buffett Indicator.
Buffett first introduced his indicator back in 2001, right in the middle of the internet bubble collapse.
The metric takes the total U.S. stock market capitalization and compares it to gross domestic product (GDP).
It’s similar to how you might evaluate the level of stock prices compared to earnings. But in this case, the Buffett Indicator takes the total value of stocks and compares that to the overall economy.
Buffett called it the “best single measure of where valuations stand at any given moment.”
When the indicator is below 100%, that means the total value of the stock market is running below GDP. Buffett suggested that a range of 70% to 80% is a reasonable level to buy stocks.
But when the ratio starts to push above excessive levels, that’s a bubble warning… which is why the indicator is triggering alarm bells today.
Buffett used his indicator to detect when stocks were collectively cheap or overvalued.
When the Buffett Indicator pushes to the 200% level and beyond, Warren himself said that investors “are playing with fire.”
That makes today’s level especially concerning. Here’s the Buffett Indicator over time:
Total value of all publicly-traded stocks / GDP Ratio
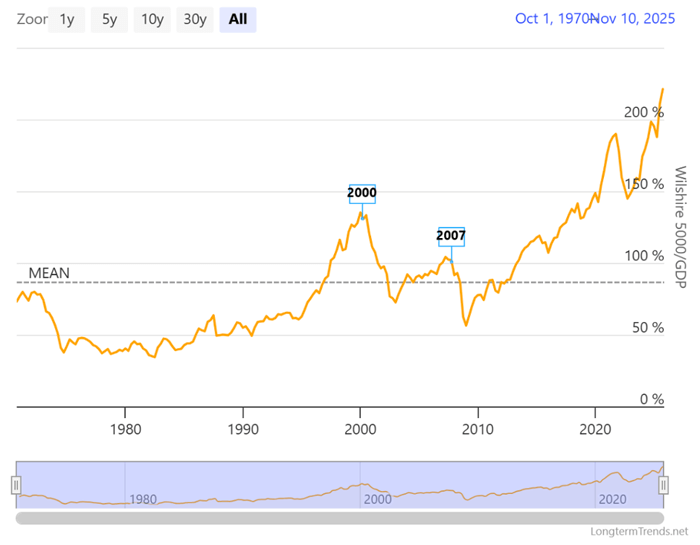
Source: Longtermtrends.net
At 223%, the indicator is being pushed to the highest level ever seen. That’s more stretched than just before 2008’s Financial Crisis and 2022’s bear market.
Valuations have easily eclipsed the levels seen at the peak of the internet bubble.
Naturally, that may strike fear in investors… But it makes experienced traders excited for the opportunities ahead.
Excessive valuations have always paved the way to a period of high volatility. I’ve delivered some of my best returns for clients and subscribers when the times get tough.
That’s because panic alongside a jump in volatility spells opportunity.
Remember, even Buffett scored some of his best wins when excessive valuations led to plunging stock prices.
So if the Buffett Indicator’s warning holds true, then Buffett may not stay quiet for long.
Happy Trading,
Larry Benedict
Editor, Trading With Larry Benedict
Reading Trading With Larry Benedict will allow you to take a look into the mind of one of the market’s greatest traders. You’ll be able to recognize and take advantage of trends in the market in no time.
