Managing Editor’s Note: On Wednesday, our colleague Jeff Brown is teaming up with Jason Bodner to reveal what they’re calling the most explosive asset class of 2026: “Secret AI Stocks.”
These are a small group of “hidden” stocks that they believe could transform into the next trillion-dollar super stocks. Each one is quietly becoming essential to AI – but the market hasn’t discovered them yet.
Already, these two experts have used “hidden” investments like these to deliver gains as high as 105%, 711%, 1,077%, and even 32,012%… And now they’re teaming up to showcase a system for spotting them before they become household names.
They’re getting into all the details on February 25 at 8 p.m. ET. You can go here to add your name to the guest list…
The stock market may look calm on the surface, but it’s trading as if something’s broken.
Even officials at the Federal Reserve are flagging the risks around the market. In the recently released minutes of its last rate-setting meeting, the Fed had this to say (emphasis added):
Some participants discussed potential vulnerabilities associated with recent developments in the AI sector, including elevated market valuations, high concentration of market values and activities in a small number of firms, and increased debt financing.
That’s a clear nod to the surging market valuations of the AI stocks that dominate the S&P 500. The top 10 stocks in the S&P 500 make up 41% of the index, which is near the highest level ever seen.
The Fed is concerned that volatility in the stock market could have a spillover impact on the economy. And with market concentration running at such high levels, the risk is that moves in a small handful of companies could spike in volatility levels.
In fact, that’s exactly what’s happening.
Today, let’s look at the signs that a spike in volatility is underway – and why that’s good news for traders.
You’ve probably heard about the CBOE Volatility Index (VIX). It tracks expected volatility in the S&P 500. The VIX has earned the nickname “Wall Street’s Fear Gauge” because it tends to jump when the S&P is selling off.
Looking at the VIX chart below, you may wonder what all the fuss is about right now. While the VIX is rising from the lows seen at the end of December, it hasn’t spiked like in past moments of panic.
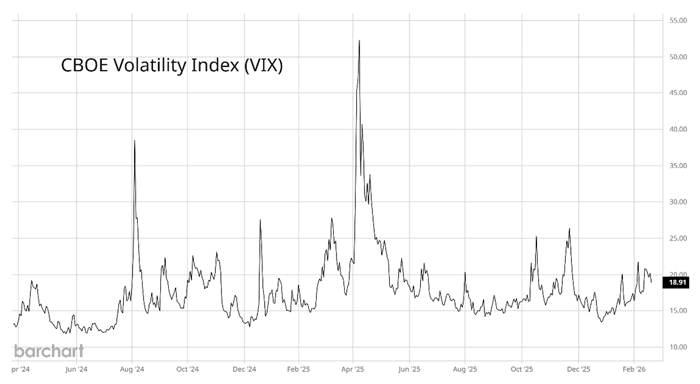
As you might expect, moderate VIX levels hint that the S&P 500 hasn’t been doing much. Since December, the index has been stuck trading in a range between 6,700 on the low end and 7,000 on the high end – about a 4% range.
But the calm on the surface is masking what’s going on under the hood. The Fed’s fears about market concentration in AI and mega-cap growth stocks are playing out.
An ETF tracking the “Magnificent 7” is down about 11% from its peak late last year. However, other sectors are rallying and offsetting the weakness seen in the biggest stocks.
Here’s one way to visualize the change in sector leadership seen this year. The graph below shows sector performance in 2025 (orange bars) compared to performance so far in 2026 (blue bars).
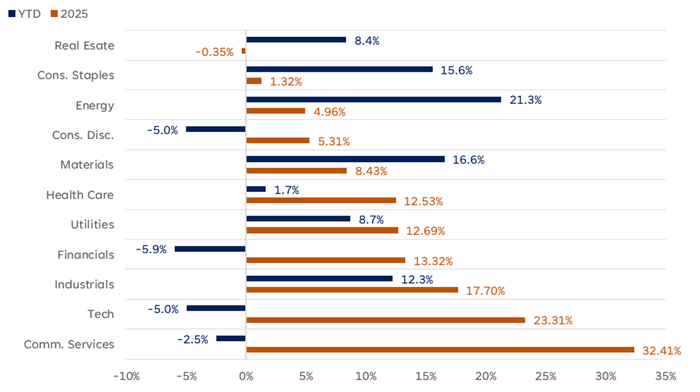
Source: LPL Financial
Look at what’s happening in the tech sector and communication services (which includes companies like Meta Platform and Google-parent Alphabet). Following stellar returns last year, they’re among the worst sectors so far this year.
And last year’s laggards like energy, real estate, and consumer staples are now leading the way.
So big changes are happening under the surface, which are creating risks and opportunities along the way.
With a sector rotation underway, volatility is rising within the S&P 500.
Another metric to look at is “return dispersion,” which compares the return of the index to the movement in the average stock held in the S&P.
Over the past month, return dispersion has spiked to the highest level seen since the period around the Great Financial Crisis in 2008.
While the S&P looks like it’s going nowhere, its holdings are mixed. Some stocks are seeing sharp declines, balanced by offsetting rallies in others.
Looking back over the past 30 years, this level of return dispersion usually appeared during times of market turmoil, like the period following the internet bubble in 2000. But it’s a little different this time.
Stocks leveraged to the AI trade could wreak havoc on the indexes, given their massive weight this time around. But we’re seeing evidence that the average stock is holding up just fine. That’s why we’re seeing the jump in return dispersion.
The good news is that turmoil like this shouldn’t scare you. It’s the exact opposite… These are the types of environments where active traders can thrive.
I’ve traded through periods like 2008 and around the internet bubble, and I handed my hedge fund clients gains every year for 20 straight years..
I put together a special briefing showing you how I would trade the turmoil this time around, including a ticker I think is worth paying attention to in 2026 as this rotation happens.
With sharp upsets happening more and more frequently (like the Supreme Court ruling against Trump’s tariffs, to name just one), this ticker looks primed to benefit. You can watch right here.
Happy Trading,
Larry Benedict
Editor, Trading With Larry Benedict
Reading Trading With Larry Benedict will allow you to take a look into the mind of one of the market’s greatest traders. You’ll be able to recognize and take advantage of trends in the market in no time.
