A powerful four-day rally delivered the best stretch for the Nasdaq-100 in over a year.
During that span, the Nasdaq jumped by 9.3% and added $3.5 trillion in market value as stocks leveraged to AI spending saw a massive turnaround.
That includes semiconductors. The VanEck Semiconductor ETF (SMH) gained 14% over the same stretch.
Other indexes are jumping as well. The S&P 500 gained 5.7% over the same four-day period. That was enough to send the S&P to fresh record highs.
Now the question becomes: Is this a dead cat bounce in stocks geared to the AI trade, or is it the start of a more meaningful move higher across the stock market?
We can turn to stock market breadth for the answer.
Breadth is a way of measuring participation in the prevailing trend. In other words, as indexes are breaking out, how many individual stocks within the indexes are moving higher?
There are a number of ways to measure breadth, such as monitoring how many stocks are making new 52-week highs.
You can also track the number of advancing stocks relative to declining ones on any given day. Or you can compare the volume in advancers versus decliners.
We can also look at how many stocks in an index are trading above key moving averages.
When we’re coming off an exceptionally strong period of short-term returns, I look for the presence of something called “breadth thrusts.” Thrusts are extreme readings in the number of advancing stocks relative to declining ones.
If we see an abnormally high figure, it indicates very broad and heavy buying pressure – the kind driven by the institutional smart money.
Those are the investors needed to sustain a longer-term advance.
And when I look at breadth metrics around this most recent short-term burst, I’m not excited by what I see…
One of the simplest ways to monitor for breadth thrusts is to look at a ratio of advancing stocks relative to declining ones (A/D ratio).
You can do that for just about any index or stock exchange. One popular way is to use the A/D ratio for stocks listed on the NYSE.
The chart below shows the A/D ratio since the start of the year.
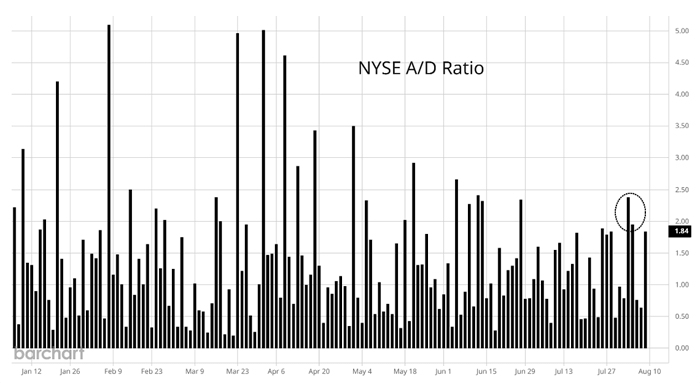
During the four days of strong gains, the highest daily reading on the A/D ratio came in at just 2.4 (circle). That means there were a little over two advancing stocks for every declining one on the NYSE.
That’s an okay figure on any given day but hardly the stuff that sustains an advance over the long term. It’s well off the best readings seen this year, and it lacks the breadth punch seen during similar short-term rallies.
Coming off the lows in April 2025 (when the tariff-driven selloff was driving markets lower), the A/D ratio registered a reading of 37.2, which was the last time the Nasdaq saw a similar short-term rally.
Recent breadth metrics tell me that the smart money doesn’t want to own stocks at these levels, and that the large gains were driven by a rally in oversold AI stocks.
Since the smart money doesn’t seem to be interested in chasing the rally, you should be cautious too.
Regards,
Larry Benedict
Editor, Trading With Larry Benedict
Reading Trading With Larry Benedict will allow you to take a look into the mind of one of the market’s greatest traders. You’ll be able to recognize and take advantage of trends in the market in no time.