Inflation anxiety is running high following the war in the Middle East.
Tanker traffic moving through the Strait of Hormuz is at a crawl compared to before the U.S. and Israel attacked Iran. About 20% of global oil consumption, 20% of liquefied natural gas, and 33% of fertilizer ingredients used by farmers are transported through the narrow passageway.
Energy prices are already soaring, and food prices could follow suit. That’s stoking inflation fears at a time when key measures of consumer inflation are already running above levels preferred by central bank officials.
That’s bad for the economy – and the news could grow even worse.
So let’s look at the one ticker that can provide clues on the economic outlook… and how to trade it.
The prospect of rising inflation threatens higher price levels for things we consume every day… from fuel to food and beyond.
But inflation has another consequence for the economy at large.
The Federal Reserve has to balance risks between inflation and the labor market. The primary tool to achieve that balance is changing short-term interest rates.
But there’s a sticking point…
Inflation has already stalled above the Fed’s preferred levels. The Personal Consumption Expenditures (PCE) – the Fed’s favored inflation gauge – was most recently reported at 2.8%. The Fed targets a 2% level of inflation.
PCE hasn’t been below 2% since early 2021. Fed officials were already starting to sound the alarm on inflation during their January meeting… and that was before the breakout of war in the Middle East.
The prospect of even higher inflation has investors rethinking the rate outlook. There’s a growing probability that the Fed could hike interest rates – something unthinkable at the start of the year.
Higher rates discourage consumer spending and business investment, so recession fears are now rising as well. Betting odds on Polymarket on the chance of a recession in 2026 have recently jumped to 35% compared to 21% before the Middle East conflict started.
A dangerous mix of factors is clearly developing. And you might feel stuck trying to figure out whether inflation or recession is the most imminent concern facing the stock market.
If so, there’s one ticker you must follow…
Bond yields move in response to the outlooks for both inflation and economic growth.
On the one hand, longer-term Treasury bond yields are sensitive to inflation because bonds pay a fixed coupon payment. An increase in inflation reduces the purchasing power of those payments. So when it looks like inflation is going to be a problem, bond yields tend to rise to compensate for the loss of purchasing power.
And remember that bond prices move opposite to yields, with prices falling when yields are rising.
But on the other hand, bond yields tend to drop (and prices rise) when recession risks are growing. Historically, bonds have benefited from a flight to safety when times are uncertain.
Right now, bonds are caught in a tug-of-war between these two forces. But a breakout from a chart pattern could tip the most imminent threat facing investors. Take a look at the iShares 20+ Year Treasury Bond ETF (TLT):
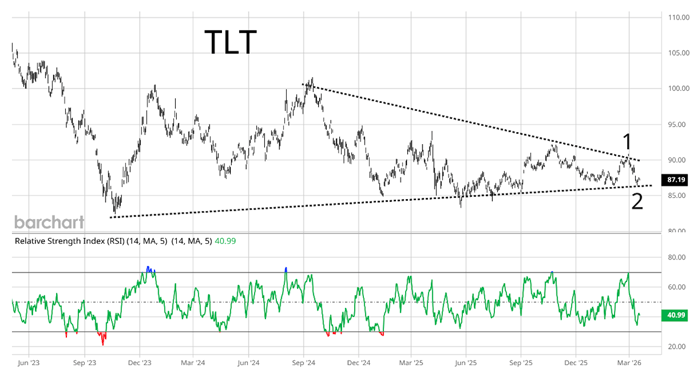
TLT tracks bond prices on the longer end of the yield curve. It has been carving out a triangle pattern since late 2023, shown with the dashed lines.
Immediately following the conflict in the Middle East, TLT made a sharp pullback after testing trendline resistance at “1.” Since investors didn’t flock to the safety of bonds, that hinted inflation was the bigger fear.
But now TLT is starting to rally following a test of the lower trendline at “2.” A bounce off that level indicates that recession fears are starting to take hold.
In order to know which catalyst is taking center stage, we need to watch for a breakout from the pattern.
A breakdown below support would point to inflation as the bigger risk. Conversely, a rally in bond prices could signal that the war and its spillover effects are pulling recession fears to the forefront.
Either way, the prospect of rising inflation or economic recession means the same thing for investors: rising volatility in the stock market.
While that may cause fear among the crowd, you could start ringing the cash register with the right trading strategy.
I’ve traded through the most difficult markets you can imagine, including the 2008 Financial Crisis and the 2000s dot-com bust. I learned how to take that volatility and turn it into a steady profit stream.
And I’ll continue to highlight the best trading strategies to profit amid these evolving market dynamics. Because in moments of chaos, you need the right plan.
With that said, I’d encourage you to tune into my upcoming event… AI Chaos to Cash. The dynamics currently impacting the stock market are causing swings in AI stocks as well. Given their large weight in indexes like the S&P 500, wobbling AI stocks are yet another point of uncertainty in the market this year.
So on March 26, at 2 p.m. ET, I’ll share the trading strategy that’s been handing us weekly opportunities to pull profits out of the market using one single ticker… and a calendar of potential trade opportunities to come in 2026.
You can add your name to the guest list with just one click.
Happy Trading,
Larry Benedict
Editor, Trading With Larry Benedict
Reading Trading With Larry Benedict will allow you to take a look into the mind of one of the market’s greatest traders. You’ll be able to recognize and take advantage of trends in the market in no time.
