Larry’s Note: Is it possible to get ahead of the next Federal Reserve decision… and turn it into a payday?
As my longtime readers know, these Fed decisions can have a big impact on the market. And the upcoming September meeting promises to be a standout. If you’re ready for it, then you could have one of your best trading days of the year.
The opportunity that’s building has to do with President Trump… Jerome Powell… and a multitrillion-dollar market event.
To give you all the details, I’m holding a Fed Decision Advance Warning event on Wednesday, September 10, at 8 p.m. ET.
I’d love to have you join me. You can RSVP with one click right here.
Then be sure to check out today’s essay, where we cover some of the difficulties facing the Fed…
The pressure to cut rates is finally getting to the Federal Reserve.
During the last Fed meeting at the end of July, officials flagged inflation risks as the primary concern. That seemed to put rate cuts on hold.
But just three weeks later, Fed Chair Jerome Powell changed it up at Jackson Hole by voicing concerns about the labor market.
All it took was a single speech to completely change the rate outlook. Odds for a cut at the September meeting stand at 96%.
That should make President Trump happy. He has demanded that the Fed slash rates to 1.0% from the current target of 4.25-4.50%. Likewise, Treasury Secretary Scott Bessent has suggested the Fed make an outsized 0.50% rate cut at its meeting later this month.
That’s stoking investor hopes of a new rate-cutting cycle, which recently sent the S&P 500 to record highs.
It looks like the Fed is caving. But one growing obstacle will limit how much the central bank can cut…
Concerns about the labor market may prompt the Fed to cut rates later this month. But the Fed is missing the mark on another directive: price stability.
The current level of inflation, along with warnings on the outlook, could limit how much the Fed can reduce interest rates.
Take the most recent Personal Consumption Expenditures (PCE) report, for example. That’s the Fed’s preferred inflation gauge.
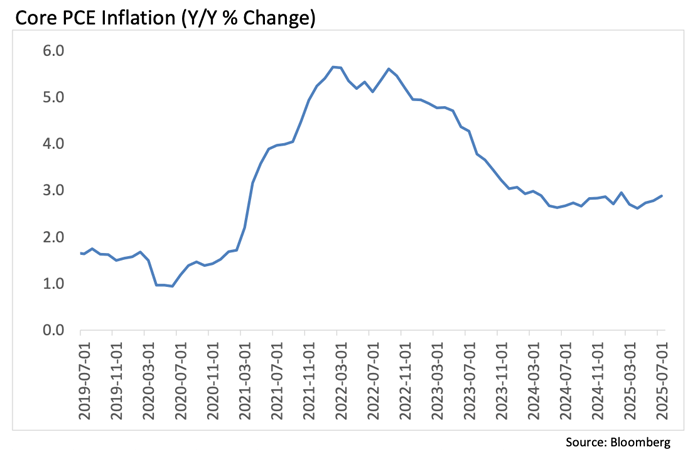
The headline PCE figure gained 2.6% in July compared to last year. The core figure that strips out noisy food and energy prices gained 2.9%. Both figures were in line with estimates, but the level and trend of inflation are concerning.
Core inflation is considered to be a better indicator of inflation trends. Ever since a big inflation wave peaked in mid-2022, core PCE inflation had been moving back toward the Fed’s 2.0% target.
But that progress has stopped and recently started moving in the wrong direction.
Take a look at the chart of core PCE.

When inflation is rising but at a slowing pace, that’s referred to as disinflation. You can see that the disinflation trend in core PCE since 2022 has been stalling out.
Core PCE has been running right around 3.0% since mid-2024. But over the past three months, it has been moving higher.
And it could get worse in the months ahead.
That’s because inflation-sensitive areas of the market are moving in the wrong direction, which could pose a major headache for investors and the Fed alike…
|
Tune in to Trading With Larry Live Each week, Market Wizard Larry Benedict goes live to share his thoughts on what’s impacting the markets. Whether you’re a novice or expert trader, you won’t want to miss Larry’s insights and analysis. Even better, it’s free to watch. Simply visit us on YouTube at 8:30 a.m. ET, Monday through Thursday, to catch the latest. |
Certain stock market sectors and other areas of the capital markets are sensitive to developments with inflation.
And they’re sending a warning on the inflation outlook.
Take gold prices, for instance. During periods of rising inflation, gold outperforms all other asset classes by far, including stocks and bonds.
Gold is breaking out of a consolidation pattern extending back to April, which I warned you about in this previous essay.
That’s not the only warning on inflation and the rate outlook. Tech stocks are vulnerable to inflation and rates as well.
Using expected earnings over the next 12 months, technology stocks in the S&P 500 are trading at a price-to-earnings (P/E) ratio of 30.2. That’s the highest sector P/E ratio in the S&P and 64% above its 20-year average.
Expensive stocks are sensitive to inflation and interest rates. That’s because falling rates help boost valuations, while rising rates put downward pressure on valuations.
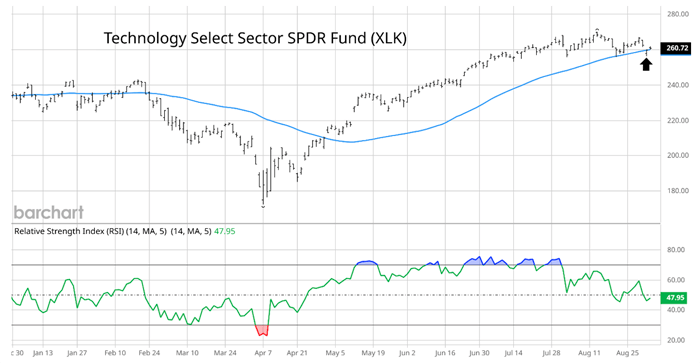
It’s interesting to note that the Technology Select Sector SPDR Fund (XLK), which tracks the tech sector, did not confirm the S&P 500’s new highs last week.
Instead, XLK made an intraday move below its 50-day moving average (blue line) this week at the arrow for the first time since April 30.

The signs may be subtle, but concerns about the inflation outlook are stacking up.
That could pose a major headache for the Fed and disappoint investors’ hopes for more rate cuts to come.
Happy Trading,
Larry Benedict
Editor, Trading With Larry Benedict
P.S. I hope you’re enjoying all of your Opportunistic Trader content. That’s why I have a favor to ask…
If you haven’t already, would you please add services@exct.opportunistictrader.com to your contacts list?
That will “whitelist” us with your email provider and help ensure these emails reach your inbox. If you’d like to learn more about whitelisting, you can check out our detailed instructions here.
Thanks for your help!
|
Free Trading Resources Have you checked out Larry’s free trading resources on his website? It contains a full trading glossary to help kickstart your trading career – at zero cost to you. Just click here to check it out. |
Reading Trading With Larry Benedict will allow you to take a look into the mind of one of the market’s greatest traders. You’ll be able to recognize and take advantage of trends in the market in no time.
