Managing Editor’s Note: On the surface, certain plays don’t seem tied to AI at all. But these stocks are perfectly positioned to become the next trillion-dollar AI mega-caps.
Jeff Brown and Jason Bodner have used “hidden” plays like these to deliver gains as high as 172%, 258%, 1,077%, and even 32,012%…
Now they’re revealing a system for spotting them BEFORE they become household names.
If you’d like to get all the details, including a free recommendation from each of them, then RSVP right here to attend their upcoming Secret AI Stocks Summit.
The “SaaSpocalypse” is cutting into some of the biggest growth stocks on Wall Street.
Fears about the disruptive impact of artificial intelligence (AI) are hitting multiple industries – but perhaps none harder than “software as a service” (SaaS) companies.
SaaS companies provide software applications via subscriptions over the cloud. They include names like Microsoft (MSFT) and Palantir (PLTR). Their share prices are down 28% and 37%, respectively, since their peaks last year.
The concern is that AI could create cheaper alternatives to SaaS companies’ products. AI agents also mean customers may need fewer software subscriptions for SaaS products.
But following these stocks’ steep declines, growing signs indicate that the downside has gone too far, too fast… and that’s creating a high-potential trade setup in SaaS stocks.
There’s an ETF tracking the software and SaaS sector called the iShares Expanded Tech-Software Sector ETF (IGV). As you can imagine, its price is taking a beating as SAAS stocks get dumped. IGV is down 22% just this year alone.
Even if the concerns over SaaS companies have merit, building evidence suggests that the sell-off in software stocks is too extreme. The downside move in IGV is triggering some of the most oversold levels ever.
We can track price momentum with the Relative Strength Index (RSI), which measures underlying momentum behind a price trend.
The chart below plots IGV along with the 50-day moving average (MA – blue line) and the RSI in the bottom panel. There are a couple of key developments to note with the RSI. First, it hit a low of 14.8 on this sell-off, which is the most oversold level seen in IGV’s 25-year history.
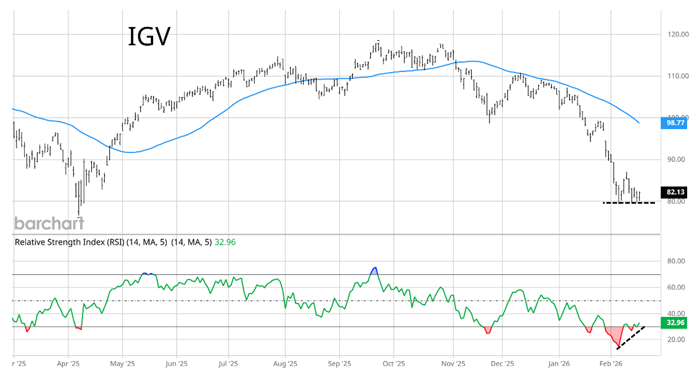
The RSI also appears to show a positive divergence. As IGV tests the low on this recent move, the RSI is making a higher low, which shows that downside momentum is fading.
IGV also traded 19% below its 50-day MA. It has only traded further below its 50-day MA less than 1% of the time.
It’s not just oversold conditions that could set up a massive reversal. Key chart levels are coming into play. And a certain type of bearish bet could actually help fuel a rally…
The presence of oversold conditions alone may not be enough to spark a reversal higher. But when it’s happening at a key price level, you should pay attention.
Here’s another look at the IGV chart:
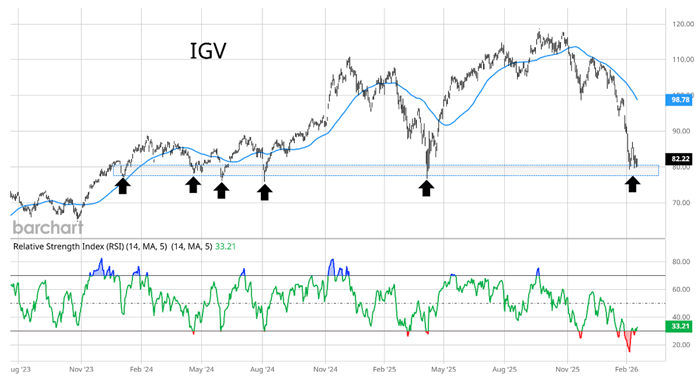
It’s no coincidence that the current sell-off in IGV hit the brakes when it traded down to the $75-80 level. That’s a price support zone that’s led to a rebound on five other occasions going back several years. You can see that with the shaded area and arrows.
The combination of oversold levels, a positive RSI divergence, and a test of key price support offers ripe conditions to see a reversal higher.
But there’s something else you need to watch with IGV – a spike in bearish bets from short sellers.
Shorting is a way to profit from a falling stock price by borrowing shares from an investor and selling them to the market. The hope is that a falling stock price allows you to repurchase the shares at a lower price when you return the borrowed stock.
Short interest looks at how many shares are being shorted as a percent of all shares outstanding. Short interest in IGV spiked to 19% last week, which is near the highest level on record.
High short interest can indicate too much bearishness, which can be a contrarian bullish signal.
But the real fuel for the rally happens when shorts are forced to “cover” or buy back the shares they borrowed. A rush to cover their positions all at once can spark a huge rally when a stock has high short interest.
A reversal in IGV could take it back to the price gap made at the $95 area at the end of January, which is 15 points of upside. You could place a stop at the $75 support level, which is 5 points of downside. Targeting a 3-to-1 return-to-risk ratio is an attractive tradeoff for oversold SaaS stocks.
Happy Trading,
Larry Benedict
Editor, Trading With Larry Benedict
Reading Trading With Larry Benedict will allow you to take a look into the mind of one of the market’s greatest traders. You’ll be able to recognize and take advantage of trends in the market in no time.
