The war with Iran is turning gold on its head.
Geopolitical uncertainty tends to send investors flocking to gold. But the monthlong exchange of military strikes in the Middle East has had the opposite effect.
Gold rallied 25% to start the year. Yet after the start of the war, prices fell as much as 23%.
Gold has been recovering since late March. And following news of a two-week ceasefire last week, gold is attempting to extend its rally.
But gold’s response to the next turn of events is anyone’s guess.
If you follow gold’s price action, though, movement around key levels can help you spot changes in its trend.
Let’s check back in on gold and look at the new levels to watch…
There’s a perfect storm of catalysts to drive volatility in gold prices. War in the Middle East, concerns over inflation from rising energy prices, government debt and deficit spending…
Yet gold prices peaked near $5,500 per ounce in late January and remain well below the high.
The chart setup suggested that gold could struggle on the loss of an important support level. I had this to say about a month ago:
During the breakout of hostilities in the Middle East, gold prices rose back toward the record high around $5,500 per ounce seen earlier this year.
Gold sharply rejected that level back in January, so it has become a key place of resistance.
The Relative Strength Index (RSI) also hinted that upside momentum was weakening. Although not a negative divergence in the strictest sense, the RSI was much lower on the retest near $5,500.
That means $5,500 remains the key hurdle for gold prices on the upside.
When it comes to support levels, on the other hand, keep a close eye on the 50-day moving average (MA).
Gold has held above the 50-day MA since last August. It has rallied following a couple of tests of the 50-day area since then. As the 50-day MA rises toward the $5,000 level, that could become a key support zone in the weeks ahead.
That provides us with important price resistance and support levels to watch for reversals over the near term.
Gold went on to lose the 50-day MA and dropped to the lowest level since November.
Following that, oversold conditions helped spark a rebound in gold. But now there are signs that the rally is running out of steam just as key resistance levels come back into play.
After touching an intraday low of $4,100 per ounce in late March, gold became oversold based on a couple of different measures. Here’s the gold chart:
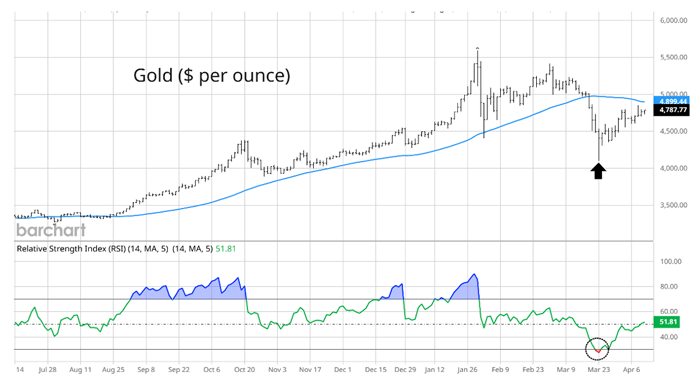
First, you can see that gold prices were extended far below the 50-day MA after crossing below that key support level. At one point, gold was 18% below the 50-day MA (arrow), which was the largest extension below in over five years.
Second, the RSI fell into oversold territory with a reading below 30 (circle). That was the lowest level on the RSI since 2023.
The presence of oversold conditions helped spark a rebound in gold prices. Yet there are signs of exhaustion and overhead resistance that could limit further gains in gold. Take another look at the chart:
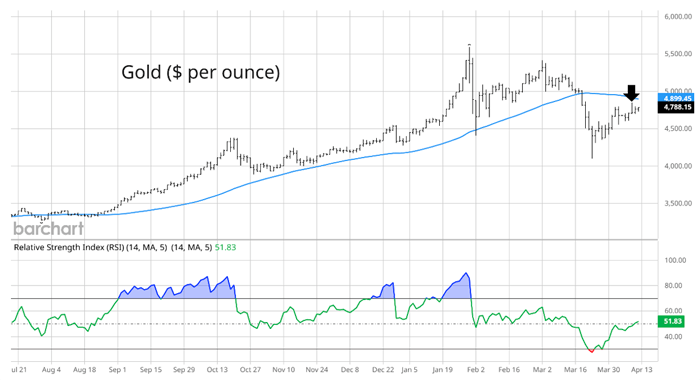
The rally in gold is taking price back toward the 50-day MA (blue line), which is now serving as a resistance level. The 50-day MA is also close to the psychologically important $5,000 per ounce level.
Also, on Wednesday last week, gold made a large intraday reversal lower (arrow), following an initial jump on ceasefire news with Iran. The fact that gold couldn’t hold onto a large gain is a warning of fading momentum.
That makes the area around the 50-day a key battleground for gold’s next move.
These kinds of big moves are making gold a great trading asset this year. I suspect we’ll continue to find profitable setups in the days ahead.
If you want to follow along with my next gold trade, you can join me now with a special offer available for brief time… I share all the details right here.
Happy Trading,
Larry Benedict
Editor, Trading With Larry Benedict
Reading Trading With Larry Benedict will allow you to take a look into the mind of one of the market’s greatest traders. You’ll be able to recognize and take advantage of trends in the market in no time.
