|
Larry’s note: Welcome to Trading with Larry Benedict, the brand new free daily eletter, designed and written to help you make sense of today’s markets. I’m glad you can join us. My name is Larry Benedict. I’ve been trading the markets for over 30 years. I got my start in 1984, working in the Chicago Board Options Exchange. From there, I moved on to manage my own $800 million hedge fund, where I had 20 profitable years in a row. And, I’m featured in the book Market Wizards, alongside investors like Paul Tudor Jones. But these days, rather than just trading for billionaires, I spend a large part of my time helping regular investors make money from the markets. My goal with these essays is to give you insight on the most interesting areas of the market for traders right now. Let’s get right into it… |
With nearly 2,000 stores across the country and $151.2 billion in annual sales, DIY giant Home Depot (HD) offers great insight into the strength of the U.S. economy.
A drop-off in sales or reduction in store count would provide proof of a slow-down in consumption, which is a key driver of economic activity.
Yet, when Home Depot released earnings results just over a week ago, it showed strong growth compared to last year.
Home Depot sales rose 14.4% for the year, and its earnings per share (EPS) grew 16.4%, putting the latest EPS number at $15.59. That’s a big improvement from just two years ago when it generated an EPS of just $10.29.
Clearly, U.S. consumers aren’t feeling tired of their DIY projects…
While financial results reflect the past, the market looks to the future. And since late 2021, the market has been marking down future prospects for Home Depot.
With jumping inflation set to bring a cycle of rising interest rates, the chart below reflects the market’s expectation for slowed growth in Home Depot shares.
It’s not a small slowdown either…
Since the start of this year, Home Depot shares have fallen 28%. Now, traders need to ask whether Home Depot shares have sold off too much.
So, let’s take a look…
Home Depot (HD)
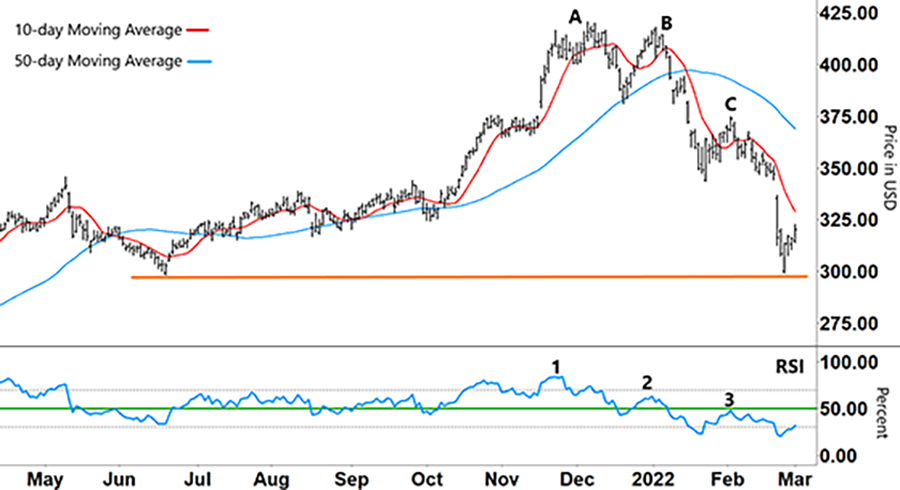
Source: eSignal
As you can see, Home Depot shares peaked at its all-time high in early December at ‘A’ ($420.61).
The sell-off in Home Depot gained momentum through January 2022 after making a lower high at ‘B.’ This down move was so strong that the 10-day moving average (MA – red line) crossed down over the long-term 50-day MA (blue line) at almost a right angle.
So, the Relative Strength Index (RSI) entered oversold territory below the lower grey horizontal line. Afterwards, Home Depot shares bounced back before running out of momentum at ‘C’ – another lower high.
This coincided with the RSI running into resistance (green line) at ‘3’ on the lower half of the chart.
Each of these lower highs in the share price (A, B, and C) coincided with lower peaks in the RSI (1, 2, and 3). Meaning that declining momentum was the cause for Home Depot’s downtrend.
The RSI went into oversold territory last week and formed a ‘V.’ Then, shares in Home Depot bounced off the $300 price level – a level that dates back to June 2021 (orange horizontal line).
So, what can we expect from here?
Well, let’s take another look at the HD chart…
Home Depot (HD)
Source: eSignal
For Home Depot’s downtrend to end, first it will need to hold above the $300 support level. From there, any potential rally depends on the action of the RSI…
The RSI recently bounced out of oversold territory, which provided short-term momentum behind Home Depot’s run higher this past week.
Right now, it’s still early in this move.
The RSI will need to rally above its resistance for the uptrend to gain momentum. That could provide the setup we need to consider a long trade.
A move like this could soon see HD shares back up around $350. After that, the next test is for Home Depot to take out its February 2 high of $374.67.
However, in such a volatile market and with so much uncertainty around, we can’t get too far ahead of ourselves…
We can expect any bounce in Home Depot shares to run out of steam unless the RSI breaks above resistance.
Regards,
Larry Benedict
Editor, Trading With Larry Benedict
P.S. Have you heard of Wall Street’s “Black Friday?” Most people haven’t. But this rare market phenomenon is actually responsible for nearly a trillion dollars changing hands in just a single day.
Because of the sheer amount of money involved, the gains can be massive. Quite frankly, I call it “Black Friday” because the profits could put your trading account “in the black” for the whole year.
To help prepare everyday folks (the next one is just two weeks away), I’m going to share all the details in a special briefing on Wednesday March 9 at 8 p.m. ET. Just click here to sign up… it won’t be available for long.
Do you trade Home Depot? If so, what are your predictions?
We’re excited to hear what you think of your new eletter, Trading With Larry Benedict. Let us know at feedback@opportunistictrader.com.
Reading Trading With Larry Benedict will allow you to take a look into the mind of one of the market’s greatest traders. You’ll be able to recognize and take advantage of trends in the market in no time.
