After plummeting in the first half of 2022, Consumer Discretionary Select Sector ETF (XLY) traded in a sideways pattern, bouncing along support.
However, on January 12, XLY found itself right at the crossroads…
Despite breaking down through its support level late last year, it had rallied back. And it was pushing up against the same price level…
A move lower from this level would have set up XLY for another leg down. But instead, XLY broke higher and rallied throughout January 2023.
Now, it’s pushing into overbought territory. So today we’ll see how XLY’s rally could play out from here…
On the chart below, you can see XLY’s downtrend in the first half of 2022…
The 50-day moving average (MA – blue line) traded sharply down. And XLY made a series of lower highs in March and August.
Take a look…
Consumer Discretionary Select Sector ETF (XLY)
Source: eSignal
Each of XLY’s peaks reversed when the Relative Strength Index (RSI) rolled over and broke down into the lower half of its range.
When the 10-day MA (red line) crossed below the 50-day MA, it confirmed the next down leg.
XLY reversed from its most recent major peak in August. It initially held its longer-term support (orange line) in October and November despite being tested multiple times.
But in December, that support level finally gave way…
With the RSI stuck in its lower range and buying momentum firmly against it – XLY drifted to fresh lows.
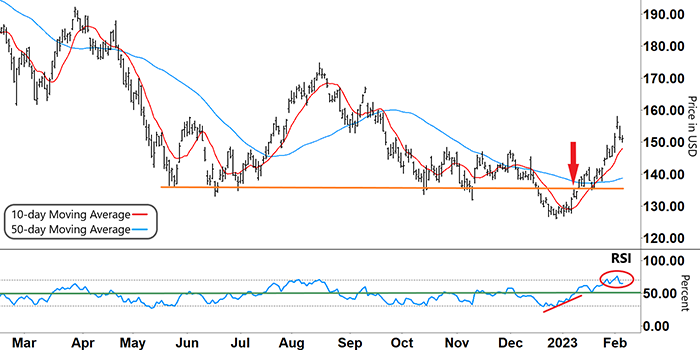
However, the RSI formed a ‘V’ from oversold territory (lower grey dashed line) and it began to track higher (lower red line). Then, XLY formed a base and began to rally (red arrow) as we came into the new year…
Take another look…
Consumer Discretionary Select Sector ETF (XLY)
Source: eSignal
As you can see, XLY broke up through resistance at the same time that the RSI bullishly broke into the upper half of its range.
After retesting and holding that level on January 19, XLY’s rally accelerated. And the RSI showed a clear increase in buying momentum.
Adding to the bullish sentiment, the 10-day MA also broke back above the 50-day MA.
That buying surge, however, has now put the RSI into overbought territory (upper grey dashed line). And now, XLY is in danger of another potential reversal.
So what can we expect next?
Free Trading Resources
Have you checked out Larry’s free trading resources on his website? It contains a full trading glossary to help kickstart your trading career – at zero cost to you. Just click here to check it out.
Recently, the RSI formed an inverse ‘V’ (red circle) from overbought territory. This coincided with XLY’s recent peak on February 2 at just over $158.
If the RSI tracks back down toward support (green line) from here, then we can expect XLY’s emerging down move to gather momentum.
And that would provide the setup for a potential short trade.
Any bigger down move beyond that would depend on the RSI breaking into the lower half of its range.
However, it’s still early days with XLY’s recent retracement…
If the RSI bounces along the overbought line without any sustained move lower, then XLY’s rally could still go further.
Regards,
Larry Benedict
Editor, Trading With Larry Benedict
How do you think the consumer discretionary sector will perform throughout 2023?
Let us know your thoughts – and any questions you might have – at feedback@opportunistictrader.com.
Reading Trading With Larry Benedict will allow you to take a look into the mind of one of the market’s greatest traders. You’ll be able to recognize and take advantage of trends in the market in no time.
