The SPDR S&P Retail ETF (XRT) rose fourfold during COVID. But it had a much tougher time of it last year.
As the Fed tried to regain control over inflation with its rapid-fire rate increases, exhausted consumers finally tightened their belts.
In just six months, XRT lost around 44% from its November 2021 peak.
After that brutal sell-off, though, XRT gradually transitioned into a sideways pattern… which carried over into this year.
That support level has been tested and held multiple times. And each time, it provided the base for XRT’s next rally.
So with XRT likely to test support yet again, today I want to see what’s coming next…
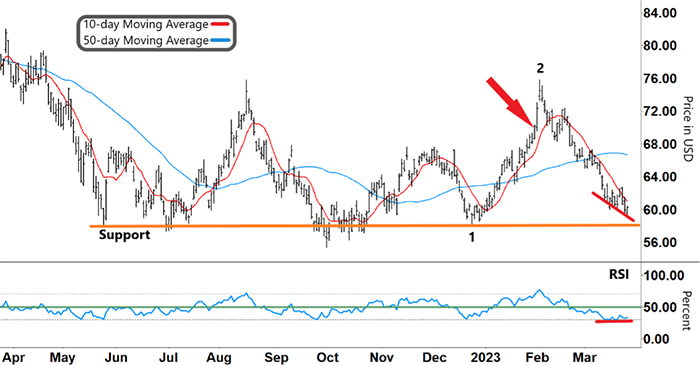
On the chart below, you can see how XRT changed from a downtrend into a sideways pattern around the middle of last year.
The long-term 50-day Moving Average (MA, blue line) flattened out around the middle of July.
Yet the shorter-term 10-day MA (red line) shows that there’s been plenty of movement in this sideways pattern.
What we’re trying to figure out with the chart is how we can trade these patterns…
SPDR S&P Retail ETF (XRT)
Source: eSignal
After first finding support (orange line) in mid-May last year, XRT has dipped down to and bounced off of support numerous times since…
These moves coincided with our momentum indicator, the Relative Strength Index (RSI), forming a ‘V’ around oversold territory (lower grey dashed line).
Then, as buying momentum increased (with a rising RSI), XRT rallied.
When we last checked out XRT on February 2 (red arrow), its December rally had begun with the ‘V’-pattern from the RSI (‘1’)…
It then accelerated as the RSI broke through resistance (green line) and into the upper half of its range.
As the chart shows, though, XRT then peaked and reversed (‘2’).
Take another look:
SPDR S&P Retail ETF (XRT)
Source: eSignal
This time, though, that reversal came as the RSI formed an inverse ‘V’ and reversed from overbought territory (upper grey dashed line)… And XRT continued to fall as the RSI tracked lower.
Now XRT is once again trading near support (orange line). The RSI is in oversold territory.
So what am I looking for around here?
Free Trading Resources
Have you checked out Larry’s free trading resources on his website? It contains a full trading glossary to help kickstart your trading career – at zero cost to you. Just click here to check it out.
In previous moves, XRT changed directions when it formed a ‘V’ (or inverse ‘V’) and reversed from oversold (‘1’) or overbought territory (‘2’).
However, that’s not the only RSI pattern that can signal a reversal…
When the RSI and stock price are heading in different directions – as they are now (red lines) – that can also precede a change in direction.
When the RSI is stabilizing and forming support (lower red line), it becomes increasingly difficult for a stock price to keep falling, as XRT is doing now (upper red line).
And the convergence of the RSI and XRT’s stock price is happening right around XRT’s long-term support level (orange line).
If the RSI bounces off support and tracks higher, we could see a nice little bounce in XRT… right around a previous strong support level.
And while it’s early days with this move, that could provide the setup for a potential long trade.
Regards,
Larry Benedict
Editor, Trading With Larry Benedict
Where do you think consumer spending is headed from here?
Send in your thoughts to feedback@opportunistictrader.com.
Reading Trading With Larry Benedict will allow you to take a look into the mind of one of the market’s greatest traders. You’ll be able to recognize and take advantage of trends in the market in no time.
