The performance of the Nasdaq these last few weeks has been extraordinary.
From its October 26 low, the Invesco QQQ Trust Series 1 (QQQ) has gained around 13%.
That’s more than the average buy-and-hold investor would expect in a year.
QQQ’s recent snap higher also puts it up nearly 50% since its January low.
It’s hard right now to imagine what could stop this runaway train. But as traders, we always need to be on the lookout for the next move.
So let’s check on QQQ to see what’s coming next…
On the chart below, you can see that QQQ has rallied strongly since the start of the year.
It saw a brief pullback from February into March. But then QQQ’s rally resumed, and it climbed through July:
Invesco QQQ Trust Series 1 (QQQ)
Source: eSignal
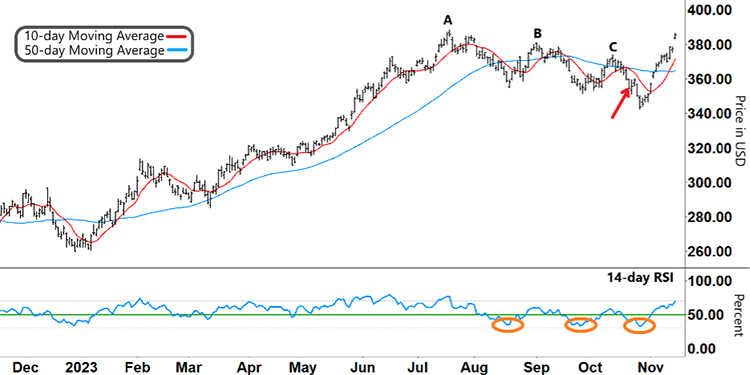
QQQ’s near-seven-month rally corresponded to two common bullish signals:
The relative strength index (RSI) broke into its upper band, where it remained throughout QQQ’s rally.
Back in January, the 50-day moving average (MA, blue line) crossed above the 10-day MA (red line). The 50-day MA continued to track above it with both MAs trending higher.
Yet a momentum reversal caused QQQ to eventually peak and reverse on July 19 at “A.”
From there, QQQ made successive lower highs at “B” and “C” as momentum (RSI) continued to wane.
This period also saw the 50-day MA roll over, signaling that QQQ’s uptrend had come to an end.
We last checked out QQQ on October 24 (red arrow). At that time, the bottom half of the RSI chart caught our attention.
Leading up to the “B” and “C” rallies, the RSI formed a “V” and rose from near-oversold territory (two left orange circles).
Take another look:
Invesco QQQ Trust Series 1 (QQQ)
Source: eSignal
With the RSI falling, we were looking for another potential bounce.
And as the chart now shows, we saw that RSI pattern repeat yet again (right orange circle).
But unlike the previous rallies, this current rally has continued to surge.
And QQQ is now trading within a whisker of its year-to-date high back on July 19.
So what potential triggers am I looking for?
Free Trading Resources
Have you checked out Larry’s free trading resources on his website? It contains a full trading glossary to help kickstart your trading career – at zero cost to you. Just click here to check it out.
In a typical rally, you’ll often see several up days (four or five) followed by a day or so of down days.
But in QQQ’s current rally, there have been just two down days since it bottomed out back on October 26.
This kind of pattern is highly unusual. It’s like the market got caught up in a wave of panic buying.
But that kind of crazy buying eventually peters out…
That means the market is vulnerable to a pullback.
And that’s where momentum (RSI) will be key.
As you can see, the RSI is closing in on overbought territory.
From here, I’ll be looking for the RSI to make a clear reversal (inverse “V”). That will show us that QQQ’s rally has come to an end.
Regards,
Larry Benedict
Editor, Trading With Larry Benedict
Readers at The Opportunistic Trader are reaping the benefits of our trades:
Hello Larry,
Our first BITO trade was like winning lotto!!! One contract, a nice profit, can’t wait for the next trade, thank you. We will compound these profits to build our account for further profitable trades. We really appreciate and look forward to receiving your regular reports on the market. Many Thanks.
– Carol W.
41% profit in 50 contracts or $7.2k! Beautiful Larry! Keep it coming!
– David M.
If you’d like to join us and learn more about how we profit from bitcoin without buying any crypto, click here for more information.
And send any questions to feedback@opportunistictrader.com.
Reading Trading With Larry Benedict will allow you to take a look into the mind of one of the market’s greatest traders. You’ll be able to recognize and take advantage of trends in the market in no time.
