Note: For nearly five years, Larry has been helping his S&P Trader members bring in solid income using a strategy he utilized for decades while working at hedge funds…
In fact, in his more than 40 years trading the markets, this strategy has been one of his most consistent income producers. And it’s helped his followers beat the S&P’s returns by 4.6X on an annualized basis.
That’s why he held his 12 Months to Retirement event earlier this week. He shared the details of this income strategy and how it can set you on the fast track to retirement.
In case you missed it, the replay is still available for a short while longer. You can go here to watch it.
“If you look at it from just a strategic asset-allocation perspective, you would probably have something like 15% of your portfolio in gold…”
– Ray Dalio
By any measure, the rally in gold this year has been spectacular. The precious metal has rallied by around 55%.
And comments like the above from Ray Dalio – founder of the world’s largest hedge fund, Bridgewater Associates – earlier this week are likely to only throw more fuel on the fire.
One of the major factors driving the surge in gold prices has been resurgent inflation. Irrespective of what the official data (when it was available before the shutdown) has been telling us, folks know that real inflation is tracking much higher…
Whether it be your weekly grocery shop or buying a cup of coffee. Everyday items are way more expensive than they were even just a few months ago.
But while there’s no telling just where gold’s going to land, latecomers to the rally need to remain extremely careful. Because gold has a habit of disappointing investors.
So, let’s consider how things could play out from here…
The chart below shows the price of gold (in USD) since the start of the year.
As you can see, there have been three distinct phases since January. That’s reflected in the 50-day moving average (MA, blue line)…
Spot Gold Price in USD
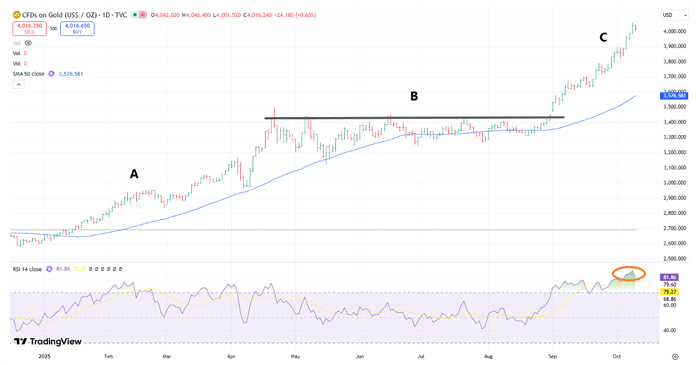
Source: TradingView
In that first section (A), the 50-day MA starts tracking higher, reflecting gold’s move up. That coincided with a strong surge in momentum with the Relative Strength Index (RSI) breaking into and bullishly remaining in the upper half of its range.
After a brief pullback in early April, gold reversed sharply higher after testing (and holding) the 50-day MA. And the RSI formed a ‘V’ and rallied from right around support (50% level).
The velocity of that up move and associated bullish news headlines pulled a whole lot of fresh folks into a long trade. Yet as the chart shows, gold soon rolled over and transitioned into a new phase (B)…
From April to August, the 50-day MA flattened out.
And as the RSI swung in and out of its upper and lower ranges, gold consolidated in a sideways pattern. During that time, it was unable to break through short-term resistance (gray horizontal line).
Then, in phase C, gold’s rally resumed…
The RSI rallied from near support, causing gold to break through resistance. And the 50-day MA turned higher, showing the longer-term uptrend remained intact.
However, after its meteoric rise, the chart is flashing warning signs that the rally could be way overbought.
So, how should folks play gold from here?
|
Tune in to Trading With Larry Live
Each week, Market Wizard Larry Benedict goes live to share his thoughts on what’s impacting the markets. Whether you’re a novice or expert trader, you won’t want to miss Larry’s insights and analysis. Even better, it’s free to watch. Simply visit us on YouTube at 8:30 a.m. ET, Monday through Thursday, to catch the latest. |
When markets get in a buying frenzy like this, it’s easy to get sucked into a trade. It’s your standard “fear of missing out” at work.
However, more frustrating than missing out on a potential gain is buying into a stock – or gold, in this case – just as the rally reverses or stalls out.
As the chart shows, those who bought into the tail-end of gold’s rally mid-April wouldn’t have turned a profit until August. That’s if they stayed in the trade at all. And for those who did, there’s every chance that rally could have reversed, putting their trades underwater.
Plus, after its latest surge, the RSI is showing (orange circle) that this rally is way overstretched…
When the RSI inevitably reverses, pulling gold back lower, those who rush into a gold trade now could soon be sitting on losses.
To be clear, I’m not saying the uptrend in gold is over. After all, as Dalio also said, there’s a hint of the 1970s around the developing inflation story and growing government debt.
But folks need to be careful about chasing gold higher. Because when it starts to be treated like any old meme stock (as it is now), it too can reverse on a dime.
Regards,
Larry Benedict
Editor, Trading With Larry Benedict
P.S. If you’re interested in trading gold, be sure to check out my podcast here.
|
Free Trading Resources Have you checked out Larry’s free trading resources on his website? It contains a full trading glossary to help kickstart your trading career – at zero cost to you. Just click here to check it out. |
Reading Trading With Larry Benedict will allow you to take a look into the mind of one of the market’s greatest traders. You’ll be able to recognize and take advantage of trends in the market in no time.
