|
Larry’s note: Welcome to Trading with Larry Benedict, the brand new free daily eletter, designed and written to help you make sense of today’s markets. I’m glad you can join us. My name is Larry Benedict. I’ve been trading the markets for over 30 years. I got my start in 1984, working in the Chicago Board Options Exchange. From there, I moved on to manage my own $800 million hedge fund, where I had 20 profitable years in a row. And, I’ve been featured in the book Market Wizards, alongside investors like Paul Tudor Jones. But these days, rather than just trading for billionaires, I spend a large part of my time helping regular investors make money from the markets. My goal with these essays is to give you insight on the most interesting areas of the market for traders right now. Let’s get right into it… |
Semiconductors are a prime example of the supply chain disruption we’ve seen over the past two years in commodities.
Because semiconductors are so essential in electrical circuitry, the global shortage caused chaos among many manufacturers… Everything from washing machines and dryers to the latest smartphones and trucks have been affected.
The shortage has also led to some clever re-engineering to keep products moving out the door. For example, car manufacturers had to scavenge chips from low-end models to keep production lines on higher-end (and higher margin) models flowing.
For an industry tight on supply and struggling to meet demand – fueled by a massive dose of government stimulus – the shortage saw the VanEck Semiconductor ETF (SMH) go on an absolute tear.
In just 18 months, the share price of SMH tripled.
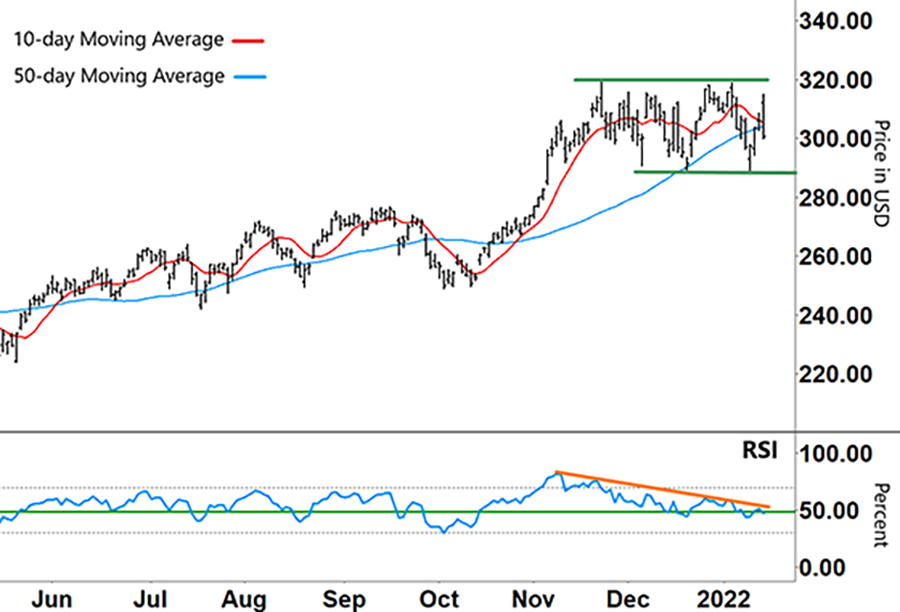
However, after rallying strongly again last October, SMH started to run into some resistance. As you can see in the chart below, SMH is now transitioning into a different pattern…
VanEck Semiconductor ETF (SMH)

Source: eSignal
After hitting its all-time high of $318.82 on November 22 last year, SMH failed to move any higher. That level now serves as resistance (top green horizontal line).
Even before SMH peaked in November, the Relative Strength Index (RSI) at the bottom of the chart was already showing that SMH was overbought (above the upper grey horizontal line at 70%). The RSI had peaked on November 9 – 13 days prior to SMH’s high.
The RSI has been in a steady decline since then, which I’ve marked with a sloping orange line in the lower half of the chart.
On December 20, the RSI bounced off its 50% support level – a move that coincided with SMH also bouncing off the low and forming the first point of its current support level around $290.
Last week this pattern repeated… SMH bounced off the lower green line on the chart and formed the second point along the support line – along with the RSI forming a ‘V’.
However, this time the RSI ran out of momentum a lot sooner. Currently, it’s right on that support level (50%). So how do I see things playing out from here?
Well, let’s take another look at the chart…
VanEck Semiconductor ETF (SMH)

Source: eSignal
The first clue lies directly within the price chart. If SMH continues to fall lower, it will soon test support again. For this emerging sideways pattern to hold, SMH will need to hold this support at the lower green line…
I’ll also continue to watch the RSI. If it stays at or above support (50% level) and moves higher, and if SMH can hold its support level on the price chart, then that could create the opportunity for a long trade.
Even if the RSI falls below support (50%) all the way down to oversold territory (below the lower grey horizontal line at 30%) – and SMH trades off support – that could prove an even stronger signal to go long.
That’s because with the stock being so oversold, it’s more likely to bounce than decline even further. An oversold stock runs out of sellers, leading buyers to step in and take the stock higher.
Remember, we’re trying to capture an upward move to the upper side of the emerging sideways trading channel between the two green lines. That means a price target of around $320 (the resistance line) on a long trade.
Conversely, an overbought signal on the RSI along with SMH rebounding lower off resistance could provide an opportunity to go short (and let us profit as the stock falls).
That’s the beauty of a rangebound market. It provides plenty of opportunities to generate trades in either direction.
So if SMH breaks below its current support level – along with the RSI continuing to trend down – that could mean SMH is changing into a downwards pattern.
The 50-day moving average (MA – blue line) rolling over and moving lower, along with the 10-day MA (red line) crossing down and staying below it would provide confirmation of a new downtrend.
After such a long and steady move up, you can see that SMH is right in the balance. A change in direction though – even to a sideways market – always promises plenty of opportunity.
Regards,
Larry Benedict
Editor, Trading With Larry Benedict
Reader Mailbag
How much longer do you think the semiconductor shortage will last?
P.S. We’re excited to hear what you think of your new eletter, Trading With Larry Benedict. Let us know at [email protected].