Together, Russia and Ukraine account for around 30% of global wheat exports.
That’s why the ongoing war (now into its fifth month) has had a dramatic effect on the global food supply chain.
Right now, around 25 million tons of wheat are stuck in Ukrainian warehouses due to a naval blockade.
Since wheat is such a staple ingredient in most food products, its initial spike in price (following the invasion) added even more pressure to food inflation.
However, in the last month or so, some of that pressure has abated.
In fact, the Teucrium Wheat Fund (WEAT) is now trading below the level it was when hostilities began.
After such a wild ride, today I’m going to discuss what we can expect from here.
Let’s pull up the WEAT chart…
Teucrium Wheat Fund (WEAT)
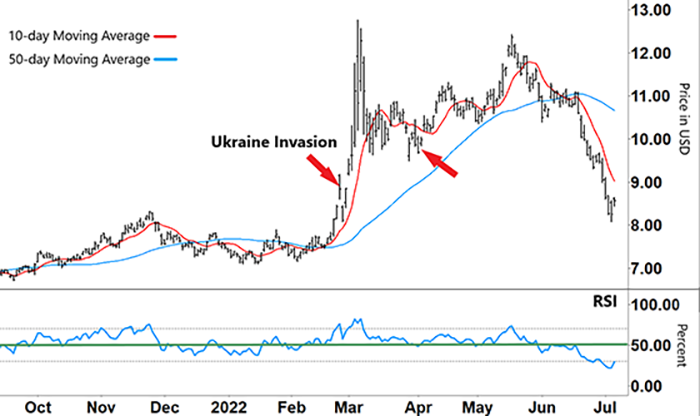
Source: eSignal
Prior to the invasion on February 24, the chart shows WEAT was trading relatively flat. The long-term 50-day moving average (MA – blue line) was meandering sideways.
And on December 2021, the 10-day MA (red line) had just crossed below the 50-day MA.
But as prospects of war grew in early February, WEAT started its wild ride.
In the space of just two to three weeks, WEAT rocketed 70% higher. The rate at which the 10-day MA broke above the 50-day MA shows the strength of that spike.
After the Relative Strength Index (RSI) showed WEAT was strongly overbought (above the upper grey dashed line), its stock price reversed and buying momentum declined.
When we last checked WEAT on April 5 (red arrow), the RSI was testing support (green line). A break below that would have led WEAT’s price to further weaken.
Take another look at the chart…
Teucrium Wheat Fund (WEAT)
Source: eSignal
However, the RSI held support and was able to remain in the upper half of its range.
So, WEAT rallied through the rest of April before peaking again in May.
Then, the RSI again showed WEAT was overbought and its current selldown began.
In early June, WEAT tried to find support around $11 as the RSI tracked around support. But the RSI broke lower into the bottom half of its range and WEAT fell strongly.
This big fall represented a 34% drop in just over three weeks. It also caused the 10-day MA to break below the 50-day MA and accelerate lower.
Now that the RSI is firmly in oversold territory (lower grey dashed line), what can we expect from here?
After such a dramatic fall, WEAT will be looking for a reason to bounce.
But just because the RSI is in oversold territory, doesn’t mean there’s enough setup evidence to enter a trade.
Over the coming days, it’s possible the RSI will continue to track in oversold territory. WEAT could fall below the $8 level.
In the meantime, we need to be patient and wait until the RSI forms a ‘V’ and breaks higher toward resistance before considering a long trade.
Regards,
Larry Benedict
Editor, Trading With Larry Benedict
What is your current sentiment toward wheat? Will we continue to see its price fall?
Let us know at feedback@opportunistictrader.com.
Reading Trading With Larry Benedict will allow you to take a look into the mind of one of the market’s greatest traders. You’ll be able to recognize and take advantage of trends in the market in no time.
