Yesterday’s parabolic rally – in reaction to Fed Chair Jay Powell’s comments – felt like it had some authority to it…
It felt definitive… like a knockout blow to the thought that we’re still in a bear market.
After a January to remember – with the S&P 500 rising 6.2% (which placed it in the top 10 best Januaries since 1950) – many were looking for “calmer” heads to prevail into the Fed meeting on Wednesday… the same way it did almost every time last year.
Last year, every rally was cut short after one of three economic releases: a CPI report, a jobs report, or an FOMC rate decision.
A dovish narrative would build in the market… Stocks would rise and then ultimately collapse.
But not this time…
Not only did the Invesco QQQ Trust Series 1 (QQQ) rise after Powell’s press conference… we also saw an additional 18% move in the futures market after Meta Platforms’ (META) earnings report.
But even before this recent melt-up, investors have been entertaining phrases like “This feels like March 2009” and “runaway momentum.”
During that time, sentiment was as low as it could get, coming off a dangerous credit crisis that threatened to stop the global economy. Yet the bottom was in, and the market just kept rising…
Runaway momentum.
Momentum is behavioral, which is why the creator of the efficient market hypothesis (Nobel Prize winner Eugene Fama) called it the “biggest embarrassment to the theory” of efficient markets.
It’s hard to fight and it just “runs away.” And recently, momentum has been flexing.
Everyone loves looking at moving averages (MAs) to gauge the market. It’s the most accessible form of analysis out there.
The S&P 500 and the Nasdaq-100 have broken out of their 200-day MAs and haven’t been willing to break back below them like they did last year. That’s bullish.
Another technical sign that should give bears some pause is that the S&P 500’s 50-day MA is on the cusp of crossing the 200-day MA. That never happened during the prior two prolonged bear markets in 2000-2003 and 2007-2009.
On its own, that’s bullish. I’ve even heard investors discuss this as a once-in-a-generation buying opportunity.
But there’s one stark difference between then and now…
Those were not periods where inflation has forced the Fed to raise rates… potentially into a recession.
But if you look back at the 1970s – the last time the U.S. economy had to fight inflation to the extent it does now – the 50-day MA traded above the 200-day MA several times before collapsing almost 50% between 1973 and 1974….
Momentum works until it doesn’t.
But despite this endless “point-counterpoint” argument about technical levels in the market… macro sentiment has been very negative. Price action has made being short the market a very painful exercise in abstaining from the view of the majority.
It’s a concern the famed investor (and unfairly labeled permabear) Robert Grantham expressed in his latest piece.
He laid out his bear case for the market but had one concern… That he’s no longer the only one bearish.
And his fear is absolutely justified… As Mark Twain famously said, “Whenever you find yourself on the side of the majority, it is time to pause and reflect.”
So reflect on this… What exactly are we trading on? Is it a Fed pivot? Is it whether we’re even going to have a recession?
If we’re trading a Fed pivot, then it first needs to be defined. If we’re talking about slowing down the pace of rate hikes, then the Fed’s latest action of raising by 25 basis points (bps) when they were previously raised by 75 and 50 should have no bearing on the market…
Fed Fund swaps – an over-the-counter instrument that bets on what the Fed Funds rate will be – have been pricing in a 25 bps rate for yesterday’s decision since October…
And, they accurately priced in the amount and pace of all of last year’s interest rate moves as well.
Right now, the June Fed Fund swaps are pricing in one more 25-bps rate hike… and have been doing so for months now.
Nothing new there. The market has been well aware of what the Fed will do, and they have actually been on the same page.
So, when I saw a wide-eyed pundit on Bloomberg TV express how a 25-bps rate hike on Wednesday was a statement move by the Fed when it could have raised by 50 bps… I was surprised by how talking heads can talk.
However, if we define a Fed pivot as the Fed actually cutting rates, then it starts to get more interesting. Because right now, that’s where the Fed swaps market and the Fed are diverging in their view.
Fed swaps for December are pricing in the Fed Funds rate to be at 4.373% after December’s rate decision. June swaps are at 4.885%…
That means the market sees the Fed cutting rates by 50 bps in the second half of 2023.
That kind of scenario can mean either inflation will get so low by the end of the year that the Fed will declare victory and cut rates… or it could be forced into cutting due to deteriorating financial conditions.
And here’s a paraphrase from Powell yesterday regarding the chance of a rate cut this year: “If the economy performs broadly in line with my expectations, it will not be appropriate to cut rates this year, to loosen policy this year.”
Meaning the only way he will cut is if there’s a recession. And that is what I believe is being priced in.
Free Trading Resources
Have you checked out Larry’s free trading resources on his website? It contains a full trading glossary to help kickstart your trading career – at zero cost to you. Just click here to check it out.
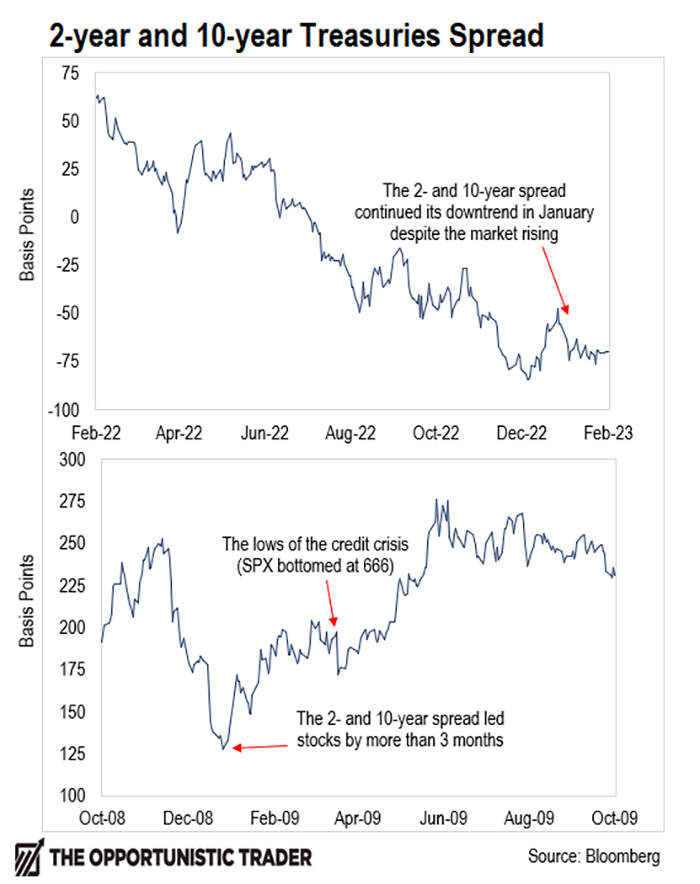
Even during this stock market run, the yield curve – represented by the spread between the 2- and 10-year Treasury yield – has gotten more inverted since the start of the year, not less.
Since many people are comparing now to March 2009, let’s look at how the yield curve behaved then versus now…
In March 2009, the spread bottomed three months before the low in stocks and then took off in April along with stocks. It’s a leading indicator with a forward lag.
Here’s a look at both…
And here’s a chart of the ratio spread between the tech-heavy Nasdaq 100 (QQQ) and the more value-oriented S&P 500 (SPY).

Despite huge up-moves in big-cap tech stocks like META and Tesla (TSLA) the last few weeks, this spread is still in a deep downtrend. That underscores that this bear market is still in a deep downtrend too.
So, will 2023 be studied in future financial textbooks as a lesson of over-anticipating recession?
Powell may have accurately answered that yesterday when he said, “The full effects of our rapid tightening so far are yet to be felt.”
Regards,
Eric Shamilov
Analyst, Trading With Larry Benedict
In today’s mailbag, One Ticker Trader members share their thoughts on Larry’s services…
I have had more success with your One Ticker Trader , than just about any other service…. My goal is to build up my account to $25K so that I can subscribe to your S&P Trader service. Thanks for your expertise… your recommendations are the only ones I trust. Thank you.
– Dennis H.
I love the service. I haven’t been able to get into every trade but the ones I have gotten into, I’ve profited on all but one. That’s a good track record.
– Beverly V.
Thanks for sending in your thoughts! If you have any questions or comments, then you can always send them to feedback@opportunistictrader.com.
Reading Trading With Larry Benedict will allow you to take a look into the mind of one of the market’s greatest traders. You’ll be able to recognize and take advantage of trends in the market in no time.
