|
Larry’s note: Welcome to Trading with Larry Benedict, my free daily eletter, designed and written to help you make sense of today’s markets. I’m glad you can join us. My name is Larry Benedict. I’ve been trading the markets for over 30 years. I got my start in 1984, working in the Chicago Board Options Exchange. From there, I moved on to manage my own $800 million hedge fund, where I had 20 profitable years in a row. And, I’m featured in the book Market Wizards, alongside investors like Paul Tudor Jones. But these days, rather than just trading for billionaires, I spend a large part of my time helping regular investors make money from the markets. My goal with these essays is to give you insight on the most interesting areas of the market for traders right now. Let’s get right into it… |
Today, I want to revisit a stock that sits right at the center of any change in interest rates…
We last checked out the iShares iBoxx $ High Yield Corporate Bond ETF (HYG) in early February.
Back then, we saw how the prospect of higher rates had already seen money flowing into to safe-haven assets like government bonds.
Rather than just looking at interest rate moves in isolation, I view them in the context of money flow…
Meaning, how a change of interest rates causes the transfer of funds between different asset classes.
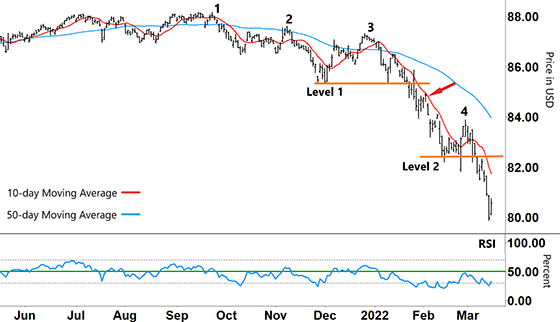
The chart below shows how HYG has continued to move lower since early February (red arrow) …
iShares iBoxx $ High Yield Corporate Bond ETF (HYG)
Source: eSignal
After forming a series of lower highs at ‘1,’ ‘2,’ and ‘3,’ HYG broke below support (level 1) and continued to fall lower.
With the Relative Strength Index (RSI) showing a decline in buying momentum, HYG fell solidly into mid-February.
The divergence between our two moving averages (MA) highlights the strength of that decline…
The 10-day MA (red line) accelerated further away and below the long-term 50-day MA (blue line).
HYG wasn’t able to form a short-term base (level 2) until the RSI bounced from oversold territory (below the lower grey line).
With the RSI finally finding some momentum, it pushed up towards its resistance (green line) but failed to break above…
iShares iBoxx $ High Yield Corporate Bond ETF (HYG)
Source: eSignal
This action capped a short-term bounce in HYG and established a new lower high (4) – confirming a bearish trend.
From there, the RSI rebounded lower off resistance, causing HYG to again break its support and sell off strongly.
This is a classic cycle that repeats in a trending market… whether up or down.
That is, a major move forming the overall trend – in this case down – with a series of shorter (and sometimes sharper) countermoves along the way.
Now, with the RSI back in oversold territory, we will see over the coming days if this pattern repeats.
So, what am I looking for around this level?
Well, first will be the action around the RSI…
If the RSI breaks out of its oversold signal and forms a ‘V’, we can expect HYG to rally. If we’re nimble enough, that could provide a quick trade to the long side.
However, I’ll be watching closely for what happens after that…
If the RSI rallies to resistance and fails to break through – meaning that HYG likely forms another lower high (5) – then we need to be ready to sell into that strength.
As we’ve seen repeatedly in this bearish pattern, when HYG breaks support (along with declining momentum), it can sell off strongly. That would provide an opportunity for a profitable short trade.
With interest rate rises firmly on the Fed’s agenda for this year and into the next, we’re going to see plenty of action in interest-rate sensitive stocks like HYG…
Fortunately, it’s the exact kind of scenario that will provide plenty of trading opportunities in both directions.
Regards,
Larry Benedict
Editor, Trading With Larry Benedict
Have you shifted your money into safe-haven assets like government bonds recently?
P.S. We’re excited to hear what you think of your new eletter, Trading With Larry Benedict. Let us know at feedback@opportunistictrader.com.
Reading Trading With Larry Benedict will allow you to take a look into the mind of one of the market’s greatest traders. You’ll be able to recognize and take advantage of trends in the market in no time.
