President Trump enjoys posting on social media.
Whether it’s the threat of new tariffs or attacks on Federal Reserve Chair Jerome Powell, Trump’s posts can carry heavy importance and move markets.
The president also posts frequently about energy markets and his desire for lower oil prices.
Goldman Sachs analyzed 900 of Trump’s energy-related social media posts. Its analysis suggests the president’s preference is for oil prices around the $40-50 per barrel range.
That’s over 20% below current levels. It would also put oil prices at their lowest level since 2020.
Yet several catalysts are lining up that could push oil prices lower… and break one key chart level toward Trump’s price target…
Oil prices reflect the balance of supply and demand. They also add a geopolitical premium to account for conflicts in key oil-producing regions.
Now each driver could be lining up to help push oil prices lower.
For starters, production across key regions is quickly increasing. Take the U.S., which is the top-producing nation in the world.
U.S. crude production is expected to hit a record 13.41 million barrels per day in 2025 as producers find ways to extract more out of their wells. But that’s not the only supply coming to the market.
The OPEC oil cartel is fully reversing its prior production cut meant to prop up oil prices. The group announced that production among its members will increase by 547,000 barrels per day in September. That follows a series of output hikes earlier this year.
And at the same time that supply is increasing, the demand outlook is taking a hit.
Uncertainty over the trade war’s impact is leading to a pullback in oil demand. The International Energy Agency has cut its oil demand forecast five times this year. It has reduced oil demand estimates by 350,000 barrels per day since the start of the year.
Even the geopolitical premium in oil prices is starting to diminish.
The ceasefire between Israel and Iran remains in effect. And Trump is trying to broker a peace deal that would end the conflict between Russia and Ukraine. Combined, Iran and Russia are about 15% of the global oil market output.
So a perfect storm of factors could be lining up to push oil prices lower.
But first, one key chart level needs to give way…
|
Tune in to Trading With Larry Live
Each week, Market Wizard Larry Benedict goes live to share his thoughts on what’s impacting the markets. Whether you’re a novice or expert trader, you won’t want to miss Larry’s insights and analysis. Even better, it’s free to watch. Simply visit us on YouTube at 8:30 a.m. ET, Monday through Thursday, to catch the latest. |
If Trump wants $50 oil prices, bearish catalysts will need to come together and push oil through the $60-65 support zone first.
That’s a key area tested several times since 2023, as you can see in the shaded box of the chart below.
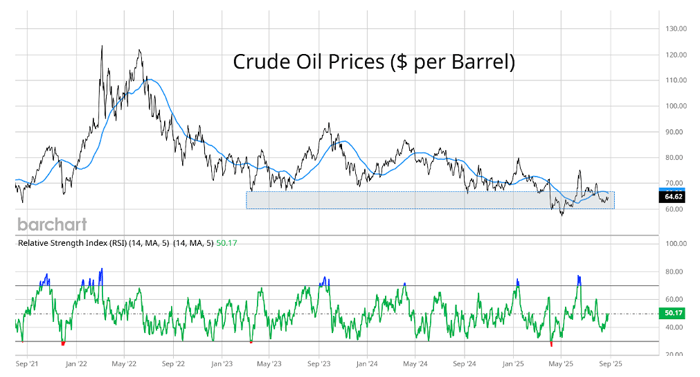
Oil attempted to break down through the range earlier this year. But Israel’s brief war with Iran sent prices higher.
But even with the spike following the conflict, prices are still trading in a long-term downtrend. And the oil price recently took out one key support level.
Take another look at the chart:
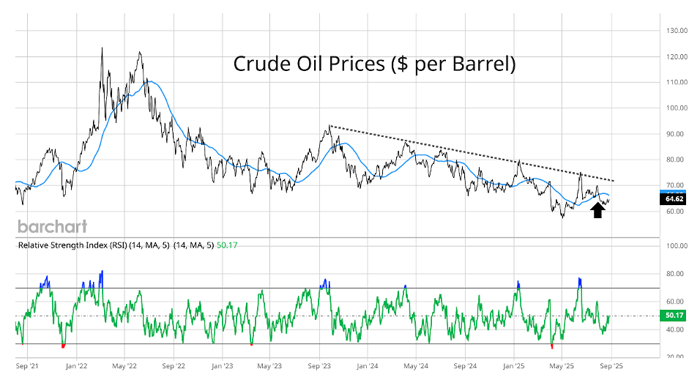
The dashed line shows oil’s overall downtrend since late 2023. That served as resistance yet again when oil spiked in June.
More recently, oil is losing support at the 50-day moving average (MA – blue line) at the arrow.
That shows the underlying momentum in oil prices is weakening once again, while oil is still trading near support at the $60 area.
If the $60 level finally gives way, oil prices could be trading at Trump’s target in no time.
Happy Trading,
Larry Benedict
Editor, Trading With Larry Benedict
|
Free Trading Resources Have you checked out Larry’s free trading resources on his website? It contains a full trading glossary to help kickstart your trading career – at zero cost to you. Just click here to check it out. |
Reading Trading With Larry Benedict will allow you to take a look into the mind of one of the market’s greatest traders. You’ll be able to recognize and take advantage of trends in the market in no time.
