Proponents of Bitcoin liken it to “digital gold.” But Bitcoin trades more like a high-beta growth stock.
Bitcoin often mimics the ups and downs of software stocks. And right now, that’s painting an interesting picture of those stocks.
The iShares Expanded Tech-Software Sector ETF (IGV) tracks software companies – and has imploded this year. IGV has shed 22% of its value since the start of the year.
That follows fears that quick advances in artificial intelligence (AI) applications will enable AI to serve as cheaper alternatives to software products.
Meanwhile, Bitcoin is also down over 20% year-to-date. That may seem like a coincidence, but the correlation between Bitcoin and software is nothing new.
And one key dynamic in their price behavior hints at a major trend reversal ahead…
Bitcoin and software stocks have been highly correlated since at least late 2024. Their directional movements have been closely aligned since then.
There are several possible explanations for the correlation.
Both groups are sensitive to the outlook for liquidity and financial conditions. And Bitcoin and software companies could both face existential threats from AI.
Bitcoin and software may also share a similar investor base, making both sensitive to changes to risk-on and risk-off sentiment.
Whatever the case, they’re moving in lockstep, as you can see in the chart below:
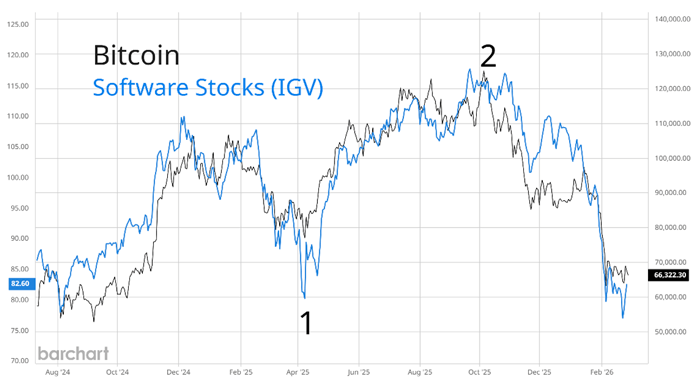
Notice that Bitcoin has led many of the key reversals and changes in the trend.
For instance, Bitcoin hinted at a sharp reversal higher during the depths of the trade war sell-off. You can see that Bitcoin (black line) didn’t make a lower low at “1” while IGV (blue line) kept falling.
More recently, you’ll notice that Bitcoin peaked and turned lower at “2,” which warned of downside in IGV weeks in advance.
With that relationship in mind, Bitcoin’s chart pattern could be warning of another reversal in IGV.
Recently, Bitcoin failed to take out a key level, while IGV kept pulling back. Take another look at the chart below:
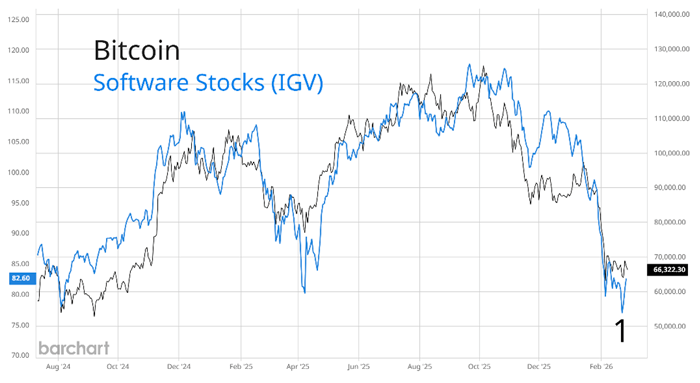
You can see that IGV made a new low at point “1” last week, but Bitcoin didn’t confirm that new low. Instead, Bitcoin held the prior low made at the start of February.
There are other bullish aspects to Bitcoin’s chart as well.
The crypto’s latest drop has brought it back to levels seen before the 2024 election. It has fallen as low as $60,000. That’s a major area of price support.
Meanwhile, a positive momentum divergence is developing as well. Take a look at the Bitcoin chart:
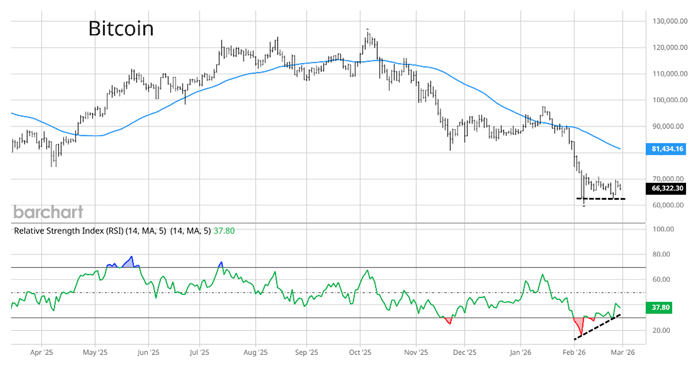
Not only did Bitcoin fail to confirm the most recent low in IGV, but Bitcoin is also receiving a positive signal from the Relative Strength Index (RSI). The RSI is making a higher low as Bitcoin tests the lows from early February. That shows downside momentum is fading.
If we see a strong reversal higher in Bitcoin off these levels, that could point to a big rally coming soon in software stocks.
Happy Trading,
Larry Benedict
Editor, Trading With Larry Benedict
Reading Trading With Larry Benedict will allow you to take a look into the mind of one of the market’s greatest traders. You’ll be able to recognize and take advantage of trends in the market in no time.
