The stock market finally saw its first pullback since the trade war plunge.
The S&P 500 dropped 5% from the peak in October to late November. The S&P hasn’t seen a drawdown that large since March.
The drop even saw support at the 50-day moving average (MA) give way for the first time in 138 trading sessions. That was the second-longest streak above the 50-day MA in history.
But just as quickly as the decline appeared, most of the drawdown has already been erased.
The stock market rallied sharply heading into Thanksgiving week, and now the S&P 500 is just a hair below the prior record high.
That said, key leading stocks saw much steeper declines during the pullback… and many are missing out on the most recent rally attempt.
Given their importance in pushing the major indexes to new heights, these leaders had better not go missing for long.
Let’s look at what’s at stake…
Companies leveraged to the artificial intelligence (AI) trade are among the biggest winners of this bull market.
That includes many members of the “Magnificent 7” stocks. They have accounted for well over half of the S&P 500’s gains since the bull market started in late 2022.
But there are concerning developments among several of the stock market’s leaders.
The drawdown across AI stocks in particular was much larger than the drop seen in the indexes. Meanwhile, the recovery in key AI stocks has been lagging.
Take Nvidia (NVDA), for instance, which is the most important AI company out there. The stock lost 18% from the peak in October, and it is struggling to rally off the lows.
Some AI hyperscalers like Amazon (AMZN), Microsoft (MSFT), and Meta (META) have seen similar price action.
These kinds of leading AI stocks are struggling to recoup the losses. And they remain below their prior highs despite the recovery in other market sectors.
That could spell trouble for the major indexes… including anyone holding ETFs like SPDR S&P 500 ETF Trust (SPY) or the Invesco QQQ Trust, Series 1 (QQQ).
Top AI stocks are a key driver for the S&P 500’s price action these days. The top 10 stocks in the S&P 500 make up a record 42% of the index, with most of the concentration in AI stocks. Nvidia alone accounts for nearly 8%.
Concentration is even worse in the Nasdaq-100, which QQQ tracks.
The top 10 stocks in QQQ make up 53% of the ETF and include the familiar mega-cap AI leaders.
That heavier exposure helped send QQQ into a sharper drawdown relative to the S&P 500. Compared to the S&P’s 5% fall, QQQ sank 9% from the October peak to the low on November 21.
Given QQQ’s heavier concentration in AI names, we should keep an eye on a few developments in the chart below.
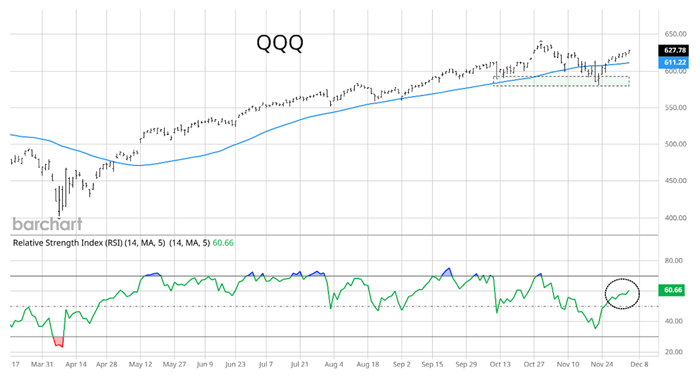
While QQQ has risen above the 50-day MA, it remains below the peak made in October. That’s worth noting since other market sectors, like small-cap stocks, are making new highs.
You should also watch the Relative Strength Index (RSI) in the bottom panel. When a primary trend changes from an uptrend to a downtrend, the RSI will often become overbought at the 60 level. QQQ is currently at that level.
From here, we want to watch for evidence of a major change in trend. If the RSI tops out around 60 (circled area) while QQQ fails to make a new high, then it’s time to watch support levels.
First is the 50-day MA (blue line). It will be a notable sign if the price starts falling to this level. Then we have price support at the $585 level (shaded area), which was the low in November.
If that low gives way, that would confirm that the primary trend is becoming bearish.
The lagging action in AI stocks isn’t something we’re used to seeing lately. If the trend persists, it could weigh heavily on the major indexes.
That could be a sign that the volatility we’ve been waiting for is finally here. As we near the end of the year and head into 2026, we may see more choppy action like we did in October and November.
So make sure you’re not caught off guard. If we’re prepared, we’ll be able to capitalize on the coming shakiness…
Happy Trading,
Larry Benedict
P.S. I recently went public with my biggest venture yet… Something I call “Benedict Capital.”
As a reader of this e-letter, it may be up your alley. You can get the details here.
You see, my hedge fund, Banyan Capital, was in the top 1%. I helped my clients make $274 million in profits. But it was for millionaires and billionaires only.
With Benedict Capital, you get to place your own trades and tailor your experience to your specific situation. And you don’t have to give me a percentage of your profits.
I hope you’ll take a look and see if it suits your needs. If you’d like to get the full picture… with a hefty discount that’s going away very soon… then please check it out here.
Reading Trading With Larry Benedict will allow you to take a look into the mind of one of the market’s greatest traders. You’ll be able to recognize and take advantage of trends in the market in no time.
