|
Larry’s note: Welcome to Trading with Larry Benedict, the brand new free daily eletter, designed and written to help you make sense of today’s markets. I’m glad you can join us. My name is Larry Benedict. I’ve been trading the markets for over 30 years. I got my start in 1984, working in the Chicago Board Options Exchange. From there, I moved on to manage my own $800 million hedge fund, where I had 20 profitable years in a row. And, I’m featured in the book Market Wizards, alongside investors like Paul Tudor Jones. But these days, rather than just trading for billionaires, I spend a large part of my time helping regular investors make money from the markets. My goal with these essays is to give you insight on the most interesting areas of the market for traders right now. Let’s get right into it… |
One stock that has flown under many investors’ radars these past couple of years has been aluminum producer Alcoa Corp (AA)…
With a market cap of less than $12 billion (some tech giants are valued in the trillions), it’s easy to see why.
But since early 2020, Alcoa has been on an absolute tear.
In its fourth quarter (Q4) and 2021 full-year results released on January 19, Alcoa announced its highest net annual income (and earnings per share) in its history.
So, what can we expect next?
After trading down to around $5 in March 2020, Alcoa recently hit a high of over $64 (January 12).
As you can see in the chart below, Alcoa’s share price doubled in the last six months of 2021 alone…
Alcoa Corp. (AA)
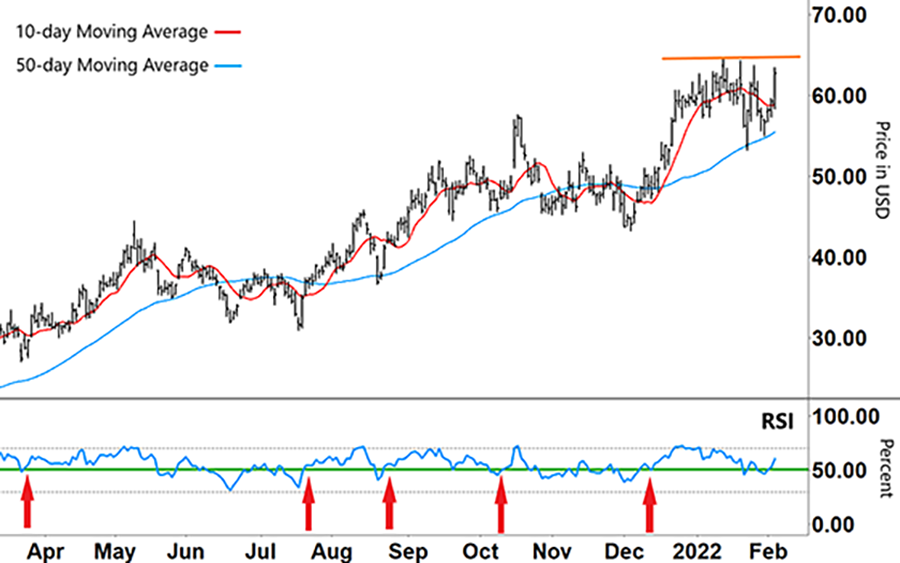
Source: eSignal
Clearly, the share price in 2021 reflected investors’ expectations of a stellar year…
The 50-day moving average (MA – blue line) shows that Alcoa has been in a long-term uptrend.
The short-term 10-day MA (red line) has been much more volatile…
That’s because Alcoa typically trades in a zig-zag pattern. This reflects that Alcoa is a commodity-based business.
Given their exposure to volatile spot (futures) pricing – and that they’re are ultimately price-takers (not makers) – commodities-based stocks can often move around a lot more than regular shares.
Often when an industrial stock is in a strong uptrend, the 10-day MA will stay above the 50-day MA. Sometimes they won’t cross over each other at all.
However, this is not the case with Alcoa…
In June and again in November 2021, you can see that the 10-day MA crossed down over the 50-day MA. But when the 10-day MA then crossed back above the 50-day MA, Alcoa went on to make a fresh high.
I’m also watching the Relative Strength Index (RSI) at the bottom of the chart…
Alcoa Corp. (AA)
Source: eSignal
You can see that after peaking late last December in overbought territory (above the upper grey horizontal line), the RSI showed declining momentum throughout the start of this year. Most recently, it’s been swinging back and forth right over the green line (support/resistance).
If we go back through the chart, we can see that this current action looks like previous patterns…
In the RSI, there are a number of red arrows. They show that when the RSI bounced off support – or broke back above it (from the lower half of the range) – Alcoa went on to rally to a new high.
(Remember that the RSI will normally stay in the top half of its band when a stock is rallying and vice versa.)
Though it’s early, I’m looking to see whether this pattern repeats…
If the RSI continues to break higher, then Alcoa could re-test its January 12 high. A break above the orange horizontal line – along with the 10-day MA swinging higher – could see Alcoa break into a new higher range.
However, if the RSI breaks below support and moves into the lower half of its range, that will tell us that momentum is waning. And that in the immediate future, Alcoa’s uptrend could run out of steam.
Regards,
Larry Benedict
Editor, Trading With Larry Benedict
What are your predictions for Alcoa’s direction?
P.S. We’re excited to hear what you think of your new eletter, Trading With Larry Benedict. Let us know at feedback@opportunistictrader.com.
Reading Trading With Larry Benedict will allow you to take a look into the mind of one of the market’s greatest traders. You’ll be able to recognize and take advantage of trends in the market in no time.
