Markets have grown unusually calm, with volatility gauges stuck at low levels for weeks.
The S&P 500 is hovering 2.5% below the all-time high, with the index grinding sideways since the start of August.
A lack of movement is sending measures of volatility to extremely low levels. The CBOE Volatility Index (VIX) is a way to track expected volatility for the S&P 500.
VIX hit its low for the year a month ago at 14. It has spent over 25 days trading between 14 and 17. That’s the longest stretch of low volatility in over 30 years.
But while it seems like the stock market is calm on the surface, a selloff is gaining momentum underneath the stock market’s hood…

Take a look at this… It’s a radical “light-speed” device that’s turning AI as we know it into “Accelerated AI”, making it 100 times faster and 100 times more energy efficient. In fact, Jensen Huang, Nvidia’s founder and CEO, says this device is shattering the limitations of AI and without it, AI can’t scale. If you want to discover what this technology is, why Nvidia is betting billions on it… And the one stock we believe could be the biggest winner when “Accelerated AI” goes mainstream… Click here to see all the details.

Larry Benedict generated $274 million in profits for his clients by knowing where money flows when the Federal Reserve shifts. He says Trump's Fed Takeover is triggering the most significant shift in U.S. markets in nearly 20 years. He's already identified the one ticker he expects billions to flood into… and he's giving away the name for free. Click here to get the full details before the window closes.
The foundation of a strong bull market is broad participation in the trend. That means there should be a large number of stocks rising when the market is rallying.
When the market is being supported by a shrinking number of stocks, that’s a warning signal that the bull market could be on borrowed time.
There are a number of ways to measure breadth, such as monitoring how many stocks are making new 52-week highs or lows.
You can also track the number of advancing stocks relative to declining ones on any given day. Or you can compare the volume in advancers versus decliners.
We can also look at how many stocks in an index are trading above key moving averages (MA) like the 50-day MA.
I refer to the 50-day MA frequently in my charts. It’s a good way to determine if a stock is trading in an intermediate-term uptrend.
When the S&P 500 is pushing higher, you want to see a large percentage of underlying stocks within the index trading above their 50-day MA.
If that figure starts to lag while the S&P is rallying or trading sideways, that signals a crumbling foundation.
This is where the action underneath the stock market’s hood is a growing concern. Despite the appearance of low volatility levels, a selloff in the average stock is picking up momentum.
A “breadth divergence” is when the stocks trading above their 50-day MA start behaving differently than the index.
Take a look at the chart below. The top half shows the S&P 500’s price action. The bottom half reveals the percentage of stocks in the S&P 500 trading above their 50-day MA.
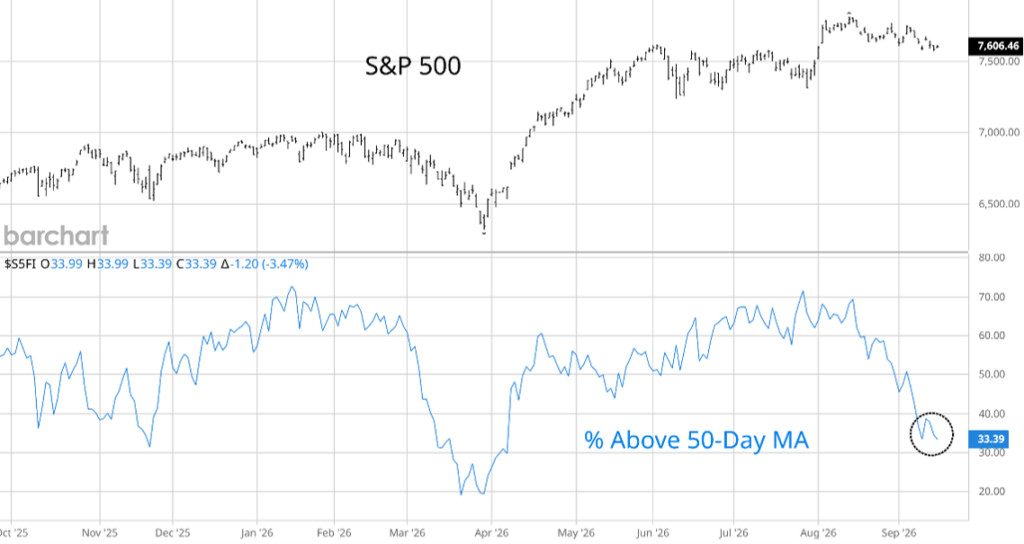
As the S&P has drifted sideways, there has been a significant drop in the percentage of S&P members trading above their 50-day MA. That figure has gone from nearly 70% on August 14 to just 33% currently.
That means only a third of the S&P’s stocks are in intermediate-term uptrends. The average stock has been pulling back for a month.
Investors have plenty to worry about – the Federal Reserve, midterms, AI taking over the world, and interest rates.
So while it may look like the broader indexes don’t care, the average stock is flagging growing concerns.
While many investors seem to expect the market to continue its upward push, it may be wiser to play things carefully as we head into the end of the year…
Regards,
Larry Benedict
Editor, Trading With Larry Benedict
Reading Trading With Larry Benedict will allow you to take a look into the mind of one of the market’s greatest traders. You’ll be able to recognize and take advantage of trends in the market in no time.