Real estate is struggling to find its footing once again.
After doubling in less than two years, the iShares U.S. Real Estate ETF (IYR) had a tough time in 2022… Commercial property fell heavily after interest rates skyrocketed.
From its January peak to its October low, IYR lost around 35%.
But after hitting that low, IYR rallied into the end of last year… which carried over into 2023.
However, that ended in February when IYR took a nearly 20% hit.
So now, with IYR again fighting to find momentum, I want to see what’s coming next…
The chart of IYR below shows a classic downtrend in action.
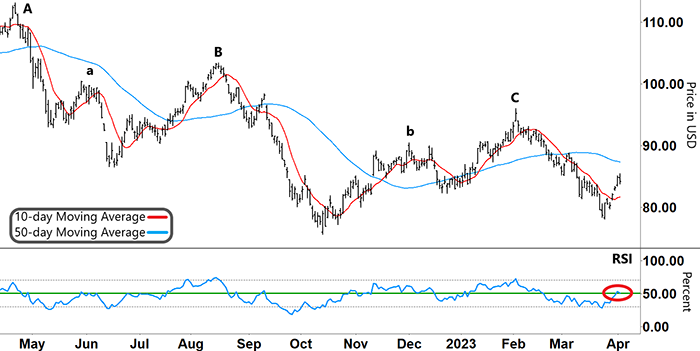
As you can see, IYR made a sequence of lower highs at ‘A,’ ‘B,’ and ‘C.’ The longer-term 50-day Moving Average (MA, blue line) also trended down…
iShares U.S. Real Estate ETF (IYR)
Source: eSignal
IYR’s down legs off those lower highs (A, B, and C) coincided with two key technical signals…
The Relative Strength Index (RSI) reversed and tracked lower from overbought territory (upper grey dashed line). When the RSI fell through support (green line) and began to track in the lower half of its band, IYR’s down move accelerated.
The shorter-term 10-day MA (red line) crossed below the 50-day MA.
On the flip side, IYR’s countermoves against the prevailing downtrend coincided with the opposite action in the RSI…
It formed a ‘V’ and rallied from oversold territory (lower grey dashed line), as in June, October, and most recently late March.
However, today, I want to concentrate on the action in between these major countermoves.
Take another look…
iShares U.S. Real Estate ETF (IYR)
Source: eSignal
After peaking at ‘A,’ IYR made a minor countermove up to ‘a.’ That came after IYR formed a trough around mid-May.
After rallying off that trough in June, the pattern repeated at ‘B’…
After making a lower low in October, IYR rallied up to a minor peak at ‘b.’ Then IYR rallied up to its next lower high at ‘C.’
So now that IYR has risen off its recent low in March, we’re trying to identify whether IYR’s pattern will repeat.
Will IYR make another minor peak at what will become ‘c’?
Free Trading Resources
Have you checked out Larry’s free trading resources on his website? It contains a full trading glossary to help kickstart your trading career – at zero cost to you. Just click here to check it out.
The RSI has rallied out of oversold territory and recently traded right up to resistance (red circle).
The action around this level will be key to what happens from here.
When IYR peaked and reversed at ‘a’ in June last year, the RSI was unable to break through resistance. Instead, it tracked sideways before heading down.
It was a similar story at ‘b’…
That time, the RSI broke up through resistance but never generated enough momentum to keep pushing IYR higher. It too kept tracking sideways before eventually falling below support.
That’s why I’ll be watching the RSI closely this coming week.
If the RSI tracks sideways for a third time before falling lower (below support), then that could provide the setup for a potential short trade.
Regards,
Larry Benedict
Editor, Trading With Larry Benedict
What are your predictions for real estate?
Let us know your thoughts – and any questions you have – at feedback@opportunistictrader.com.
Reading Trading With Larry Benedict will allow you to take a look into the mind of one of the market’s greatest traders. You’ll be able to recognize and take advantage of trends in the market in no time.
