Around 12 months ago, the Health Care Select Sector SPDR Fund (XLV) hit its all-time high.
From there, though, it lost 17% in just a couple of months. And XLV has been stuck in a sideways pattern since then, trading in a narrow $20 range.
However, there have been lots of swings – and tradeable opportunities – within this rangebound sector.
Like the recent rebound in March after three months of falls.
But now that up move is about to enter a critical phase. And today I want to see how things might play out from here…
On the chart below, you can see XLV’s big pullback after peaking last April (‘A’)…
The Relative Strength Index (RSI) peaked and reversed from overbought territory (upper grey dashed line).
Then the 10-day Moving Average (MA, red line) crossing sharply below the 50-day MA (blue line) confirmed XLV’s down move…
Health Care Select Sector SPDR Fund (XLV)
Source: eSignal
After bottoming out in mid-June, XLF transitioned into a rangebound market. The 50-day MA traded relatively flat.
As the 10-day MA shows, though, there have been plenty of swings within this sideways pattern. It has crossed the 50-day MA multiple times in both directions.
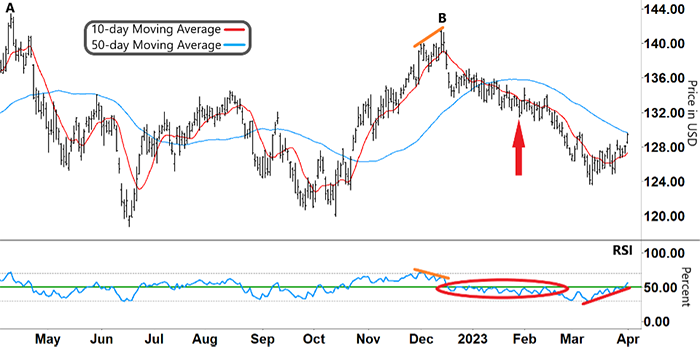
When we looked at XLV in early February (red arrow), we checked out the most recent of those crossovers…
XLV had peaked and reversed at ‘B.’ The RSI and XLV showed a diverging pattern (orange lines), as well. XLV started trending lower, and the RSI was stuck in its lower band (below the green line).
The 10-day MA crossing below the 50-day MA provided further confirmation of that down move.
During that downtrend, the RSI tried numerous times (inside the red oval) to break through resistance (green line).
But each of these moves failed, and XLV was unable to bounce…
Instead, XLV kept falling, with the RSI stuck in the lower half of its band. Adding to the bearish sentiment, the 10-day MA started to accelerate below the 50-day MA.
Take another look:
Health Care Select Sector SPDR Fund (XLV)
Source: eSignal
XLV finally bottomed out on March 13 and started its current rally – with the RSI forming a ‘V’ and rallying (red line) from oversold territory (lower grey dashed line).
XLV recently hit its 50-day MA and the RSI broke through resistance. So XLV’s emerging rally is looking promising.
What am I looking for from here, then?
Free Trading Resources
Have you checked out Larry’s free trading resources on his website? It contains a full trading glossary to help kickstart your trading career – at zero cost to you. Just click here to check it out.
After breaking through resistance, what happens next with the RSI will be key…
If the RSI can gain a strong foothold in its upper band, then XLV’s current rally will likely continue. The longer the RSI can remain in its upper band, the longer XLV’s rally could be.
The other thing I’m watching is our MAs…
XLV recently traded right on its 50-day MA. So the next test for XLV’s rally is for the 10-day MA to break back above the 50-day MA.
And stay there.
The 10-day MA accelerating above the 50-day MA would add further evidence that XLV’s emerging rally is developing into a stronger up move.
Regards,
Larry Benedict
Editor, Trading With Larry Benedict
Is the health care rally sustainable?
Let us know your thoughts – and any questions you have – at feedback@opportunistictrader.com.
Reading Trading With Larry Benedict will allow you to take a look into the mind of one of the market’s greatest traders. You’ll be able to recognize and take advantage of trends in the market in no time.
