The stock market’s rally looks unstoppable.
In just 12 days, the S&P 500 gained 11% and set fresh record highs by climbing above the 7,000 level.
That’s quite the turnaround from the S&P’s recent drop, which accelerated after the U.S. started a war with Iran.
At the end of March, the S&P was down as much as 9% from the prior high set in January. This has been one of the fastest recoveries in history.
But something is missing. While the S&P is marching higher, things don’t look so great under the hood. The average stock in the index isn’t keeping up.
So today, let’s take a look at this warning sign…
Breadth is a way of measuring participation in the prevailing trend.
There are a number of ways to measure breadth, such as monitoring how many stocks are making new 52-week highs. You can also track the number of advancing stocks relative to declining ones on any given day. Or you can compare the volume in advancers versus decliners.
We can also look at how many stocks in an index are trading above key moving averages.
No matter how you analyze breadth right now, it’s not painting a pretty picture.
On Wednesday last week, the S&P 500 closed above the 7,000 level for the first time in history. Yet only 12 stocks in the index made their own 52-week high.
In fact, only half of the stocks in the S&P are even trading in solid uptrends.
The 50-day moving average (MA) is a good way to measure the intermediate-term trend. Across all the holdings in the S&P, only 51% are trading above their 50-day MA, as you can see in the chart below.
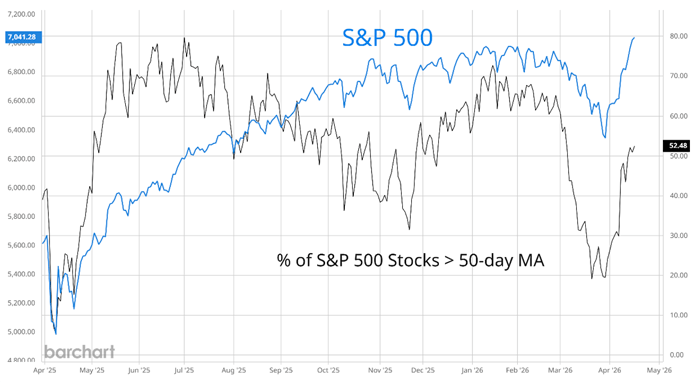
When the S&P was setting record highs in January, more than 70% of index members were above their 50-day MA.
The deterioration in breadth needs to be watched carefully… because this signal often appears ahead of a bear market.
A healthy uptrend is characterized by strong participation. That means when the S&P 500 is rallying to record highs, a large share of index constituents should be confirming the move. Narrowing breadth means the rally is on shakier ground.
Recall that only 12 stocks in the S&P made a 52-week high on the close above 7,000 last week.
Since 1999, there have been only five other instances when only 12 or fewer stocks made a new high along with the S&P. Four of those times occurred during the run-up to the Internet bubble peak.
The average stock also lagged the S&P 500 heading into the early 2000 peak, which ultimately gave way to a multiyear bear market where the S&P lost half its value.
The same thing occurred in 2007, just ahead of the Financial Crisis, when the S&P again lost half its value.
Of course, the breadth divergence could clear up with time. A jump in the average stock in the days or weeks ahead would eliminate the concern.
But if the S&P 500 keeps rallying while most stocks struggle… Look out below.
It’s only a matter of time before a rally built on an unstable foundation starts to tip over…
Regards,
Larry Benedict
Reading Trading With Larry Benedict will allow you to take a look into the mind of one of the market’s greatest traders. You’ll be able to recognize and take advantage of trends in the market in no time.
