Managing Editor’s Note: Some experts are calling it the “silent surge.”
While the mainstream media is talking about the rest of the tech market… Biotech stocks have started soaring 25%… 108%… 256%… 453%… and even 850%… in a matter of hours.
Now, if you missed any of these gains, don’t worry. As long as you act now – before July 23 – our colleague Jeff Brown believes you could average $4,000 a month, for the next four years. He’s sharing all the details in The Biotech Moment on Wednesday, July 1, at 8 p.m. ET.
Click here to automatically register for free.
Investor euphoria is being powered by the AI spending frenzy.
According to one estimate, earnings for S&P 500 companies linked to AI capital expenditures are expected to grow nearly 69% this year, followed by 34% next year.
Stocks like Micron Technology (MU) and Intel (INTC) have seen their share prices soar by 118% and 98%, respectively, in just the past eight weeks.
The rally in AI stocks has been so powerful that the S&P 500 would be down this year without them, instead of the S&P’s current 8% gain.
Indexes most exposed to the AI trade are faring even better, including the Nasdaq-100, which is now up 16% this year.
But as returns are soaring, so is volatility. That’s an unusual deviation from the historic relationship, where gains are associated with lower volatility.
That means something isn’t adding up with the AI trade…
You’re probably familiar with the CBOE Volatility Index, also referred to as the VIX. It reports expected volatility in the S&P 500. Some call it Wall Street’s “fear gauge” because the VIX usually jumps higher when the S&P 500 pulls back.
In other words, daily price movements pick up when the stock market is selling off. Conversely, the VIX tends to be the lowest when stock prices are steadily grinding higher.
Just like the S&P 500, the Nasdaq-100 has its own measure of expected volatility. As you can imagine, volatility trends across the S&P 500 and Nasdaq-100 tend to mimic each other.
But lately, a divergence is opening up. Take a look at the chart below that plots implied volatility across both indexes.
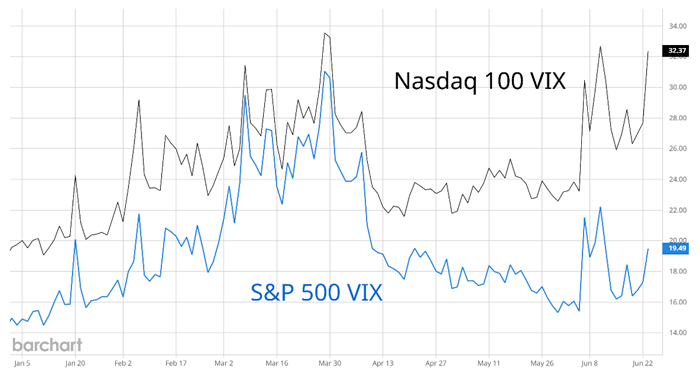
Volatility measures across the S&P and Nasdaq tracked closely to start the year. But starting in April, Nasdaq volatility started trending higher.
Even though the Nasdaq-100 has rallied to record highs, implied volatility is now trading at the same level as in late March, back when the Nasdaq fell into a correction.
That shows a major disconnect between the price action in the Nasdaq and expected measures of volatility. Remember, volatility tends to increase when stocks are selling off – and vice versa.
At the same time, another divergence on the Nasdaq’s chart is warning that the gains could be ready to reverse…
The break in the Nasdaq’s historic relationship between price and volatility means either price has gotten ahead of itself or volatility needs to pull back. Based on the chart, I’m betting that the price needs to pull back:
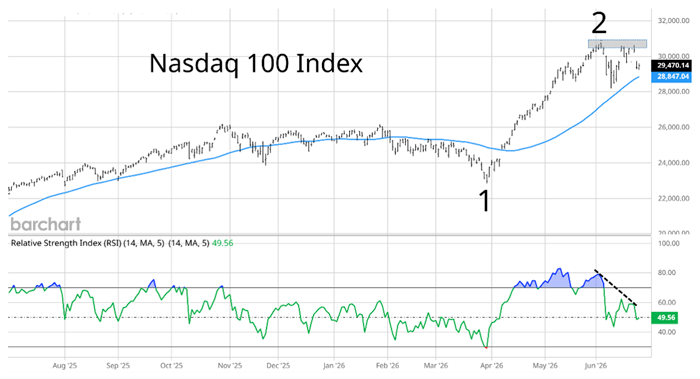
Following the high in late January, the Nasdaq fell by 12% into March (“1”). From there, a rally saw a strong move above the 50-day moving average (MA – blue line), and there was no looking back.
That rally brought the Nasdaq just above the 30,000 level in early June (“2”). A pullback from there brought the index back near the 50-day MA, and price then rallied back to the prior high.
But this is where a warning sign on momentum is appearing. As the Nasdaq tests the prior high, the Relative Strength Index (RSI) is making a lower high (dashed line).
The RSI measures underlying price momentum, and the divergence shows that upside momentum is fading. When a stock’s price makes a new high but the RSI doesn’t, it’s a sign that the buying pressure fueling the AI rally is weakening… and the odds of a reversal are growing.
Even by itself, the negative divergence is worth paying attention to.
But with implied volatility also jumping higher, it’s a signal you can’t afford to ignore.
Regards,
Larry Benedict
Editor, Trading With Larry Benedict
Reading Trading With Larry Benedict will allow you to take a look into the mind of one of the market’s greatest traders. You’ll be able to recognize and take advantage of trends in the market in no time.
