A few weeks ago, we checked in on the SPDR S&P Metals and Mining ETF (XME)…
After rallying strongly in early 2022, it reversed sharply in April and quickly headed down.
By the time XME retested and held support in July, it had given up all its yearly gains.
After a false break higher in August, XME retested and finally held its long-term support level… and began to rally. It had ground 40% higher when we checked in on it in late January.
However, that move subsequently topped out – and now XME is testing a key level. So today we’ll see what’s in store from here…
On the chart below, you can see the common pattern that led to XME’s reversal in April.
While XME was making higher highs (upper red line), the Relative Strength Index (RSI) was making lower highs (lower red line).
When these two diverge, a change of direction is likely. And that’s exactly what we saw as XME headed sharply down.
Take a look at the chart…
SPDR S&P Metals and Mining ETF (XME)
Source: eSignal
Our two moving averages (MAs) show the strength of that down move. The 10-day MA (red line) bearishly crossed below the 50-day MA (blue line) at an extreme right angle.
Then, after bouncing off support in July and September, XME’s current rally began…
When the RSI formed a ‘V’ and moved out of oversold territory (lower grey dashed line), XME’s up move started to gather pace. Soon after, the RSI broke into the upper half of its range (above the green line).
Two other bullish signals further confirmed the up move…
The 10-day MA broke back above the 50-day MA.
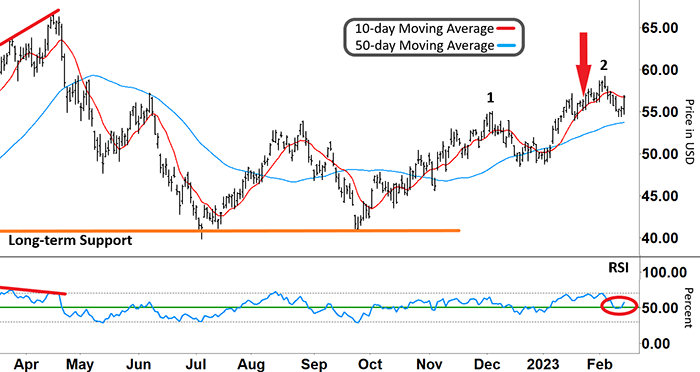
XME’s peak at ‘1’ on December 5 marked a higher high than its previous peak in August.
But after hitting that peak at ‘1,’ XME retraced into the end of 2022 before beginning its next leg up in early January.
That next leg up also coincided with the RSI breaking back into its upper range… And the 10-day MA broke back above the longer-term 50-day MA.
Take another look…
SPDR S&P Metals and Mining ETF (XME)
Source: eSignal
However, on January 26 (red arrow), I warned XME could potentially reverse if the RSI reversed out of overbought territory (upper grey dashed line).
Now, the RSI is right on support (red circle). So what am I looking for around here?
Free Trading Resources
Have you checked out Larry’s free trading resources on his website? It contains a full trading glossary to help kickstart your trading career – at zero cost to you. Just click here to check it out.
The chart shows that the RSI recently bounced strongly off support. This move coincided with XME making a strong move higher too.
If the RSI can remain predominantly in the upper half of its range from here, then that’ll help provide further momentum to XME’s rally.
The next test for XME’s rally is to make a higher high (than ‘2’) at what would become ‘3.’ However, I’ll also keep a close watch on our two MAs…
If the 10-day MA can turn higher and start accelerating above the 50-day MA, then the longer XME’s rally could be.
Regards,
Larry Benedict
Editor, Trading With Larry Benedict
P.S. There’s one more pattern happening lately that I haven’t really seen since right after 2008. But I’ve been keeping a close eye on it… because it’s creating big opportunity for traders.
This pattern involves government releases… things like inflation reports and jobs data. No one paid serious attention to these numbers until the recent bear market.
But suddenly, these releases are drawing major attention from all quarters…
And on 32 specific days this year… this increased attention is “shocking” the markets. And it’s increasing the profit potential for smart traders.
That’s why I’m putting together a downloadable calendar with every date marked. There’s one coming up just days away…
And I want to show you exactly how to trade it at my upcoming briefing on February 22. I’m calling it the “Money Shock Calendar.”
To get the full details and RSVP with one click, you can go right here.
Reading Trading With Larry Benedict will allow you to take a look into the mind of one of the market’s greatest traders. You’ll be able to recognize and take advantage of trends in the market in no time.
