|
Larry’s note: Welcome to Trading with Larry Benedict, my free daily eletter, designed and written to help you make sense of today’s markets. I’m glad you can join us. My name is Larry Benedict. I’ve been trading the markets for over 30 years. I got my start in 1984, working in the Chicago Board Options Exchange. From there, I moved on to manage my own $800 million hedge fund, where I had 20 profitable years in a row. And, I’m featured in the book Market Wizards, alongside investors like Paul Tudor Jones. But these days, rather than just trading for billionaires, I spend a large part of my time helping regular investors make money from the markets. My goal with these essays is to give you insight on the most interesting areas of the market for traders right now. Let’s get right into it… |
One of the biggest stories this year has been the huge rally in oil.
In March, the rally saw West Texas Intermediate (WTI) crude oil trade at its highest level in over a decade.
Even oil services and oil exploration stocks benefited from the rally.
You can see the strength of the rally in the SPDR S&P Oil & Gas Exploration & Production ETF (XOP) chart below…
From the start of 2022 to its April high, XOP rallied 55%.
But after hitting the high at ‘A,’ XOP become more volatile. After a sharp drop followed by a quick bounce, XOP is looking vulnerable again.
The demand for oil is dropping off the back of growing COVID cases and lockdowns in China. So, today I’m going to discuss how this could play out for XOP.
Let’s take a look at XOP’s chart…
SPDR S&P Oil & Gas Exploration & Production ETF (XOP)
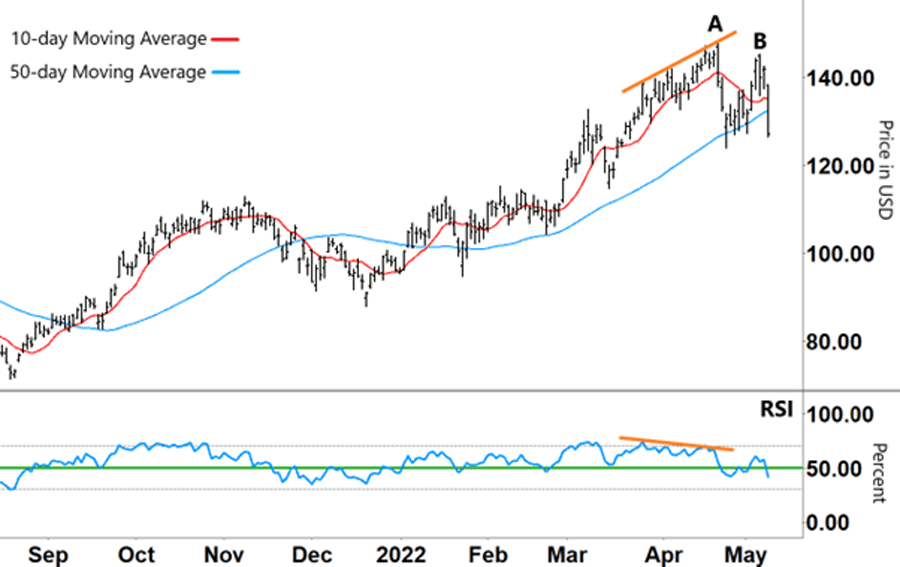
Source: eSignal
The January 2022 rally began when the 10-day moving average (MA – red line) crossed above the 50-day MA (blue line).
That strong up move in the 10-day MA also pulled the 50-day MA higher. Starting in February, the 50-day MA began to rise steeply.
However, after XOP’s recent pullback, the two MAs have begun to move closer together.
That pullback came as the result of divergence between the share price and the Relative Strength Index (RSI).
So, XOP’s share price continued to track higher (upper orange line), despite the RSI showing declining momentum (lower orange line).
Moving in opposite directions means a change in direction is often in the cards.
And that’s what happened – XOP fell sharply.
After retracing from that high, XOP tried to rally but topped out at a lower high at ‘B’ (a series of lower highs is a common pattern in a downtrend).
So, what can we expect from here?
Let’s take another look…
SPDR S&P Oil & Gas Exploration & Production ETF (XOP)
Source: eSignal
After moving close together, the MAs could soon cross…
The 10-day MA crossing down over the 50-day MA would mark the beginning of a downtrend. The 50-day MA then rolling over and heading down would further confirm the move.
I’m also watching the RSI…
The rally in XOP began when the RSI broke through resistance (green line) and into the upper half of its range.
That’s where the RSI remained throughout this year’s rally… until recently.
The selloff from ‘A’ saw the RSI break lower through support. Although the RSI briefly broke back above the green line when XOP rallied, the move lower from ‘B’ has again seen the RSI fall.
Right now, the RSI is in the lower half of its band. The action from here will determine XOP’s next direction.
And for XOP to rally, the RSI will need to break back above resistance and stay there.
However, if the RSI remains stuck in its lower range – and the 10-day MA crosses down over the 50-day MA – we know that this down move has further to go.
Regards,
Larry Benedict
Editor, Trading With Larry Benedict
I always appreciate it when people write in their thoughts. Here are some recent ones I’ve received…
I think you’re spot-on. The Fed waited way too long to move rates up. Now, it’s going to be bad for an extended period, no doubt. It’s getting harder to make great trades as the weeks move forward.
– John A.
Hi Larry,
Today marks one year since I first started using your credit spread recommendations in the S&P Trader. I’m proud to say that during that time, my portfolio has grown 33% using your recommendations.
That’s through some turbulent times, with many ups and downs, and with the 2022 market arguably off to the worst start in decades. Despite the weekly swings, persistence pays off, and the result is positive. Thank you for your service!
– Joshua H.
You perhaps missed the elephant in the room. Yes, the Fed is raising rates, but never in the history of man have we had to unwind a $9 trillion Fed balance sheet. They will not go to zero, but unwinding $4 trillion, $3 trillion dollars will have some very unforeseen consequences.
If they don’t do this, then our inflation will continue. While the Fed has raised rates, I’ve seen no evidence that the balance sheet has been impacted at all. Even in his press conference Fed Chairman Powell referred to “starting soon.”
When you see a $1 trillion drop, then we can talk, but that’s going to be a first. The chance that any human can control our economy to the extent they say, “soft landing” is hubris. In addition, hopefully the federal government will get back to a “normal deficit.”
That’ll also take liquidity out of the markets. We’re in for some dark days in equities. It doesn’t mean we can’t make money, but they will not be pretty.
– Bill W.
P.S. We’re excited to hear what you think of your new eletter, Trading With Larry Benedict. Let us know at feedback@opportunistictrader.com.
Reading Trading With Larry Benedict will allow you to take a look into the mind of one of the market’s greatest traders. You’ll be able to recognize and take advantage of trends in the market in no time.
