Inflation is on the rise once again.
After being as high as 9% in mid-2022, a trend of disinflation took the Consumer Price Index (CPI) to a low of 2.3% in April compared to last year.
That was approaching the Federal Reserve’s 2% inflation target.
According to the most recent report, CPI currently sits at 2.7%. But the most recent figure is missing a lot of data due to the government shutdown… and it relies heavily on estimated or even excluded data in the calculation.
Ongoing high inflation levels could mean trouble for the Fed rate outlook and the stock market.
But it’s not all bad news…
In fact, high inflation could be just the catalyst one corner of the market needs to move higher.
This sector delivered 65% gains as inflation ramped up in 2022.
And it could be setting up its next attempt at a big breakout…
When the economy is grappling with high inflation, one sector shines.
I’m talking about commodities.
Don’t just take my word for it. Numerous studies from academics and investment managers show just that. Take a look at the chart below.
It compares how a broad commodity index has performed during different levels of inflation going back over 50 years. The index includes products like oil, gold, and even cocoa.
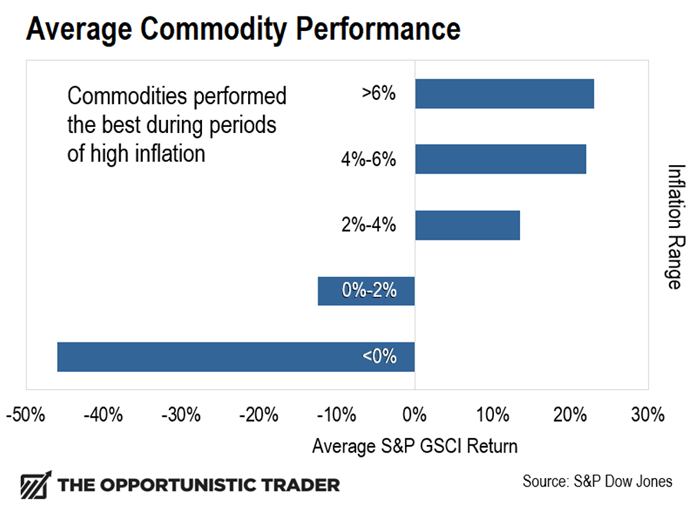
When inflation stays above the Fed’s 2% target, commodities have historically delivered an average annual return in the double digits.
During the really high inflation periods above 4%, those returns jumped to over 20%.
With those stats in mind, the chart setup of one particular fund has my attention…
CPI inflation first rose above the Fed’s 2% target in March 2021. It ultimately peaked at an annual gain of 9% in June 2022.
During that stretch, the iShares S&P GSCI Commodity-Indexed Trust (GSG) gained 65% while the S&P 500 fell 5%.
Since the peak in 2022, GSG has pulled back as CPI disinflation took hold and fell toward the Fed’s 2% target.
But zoom out to GSG’s weekly chart, and you’ll notice an interesting chart pattern that’s setting up. Take a look at the chart:
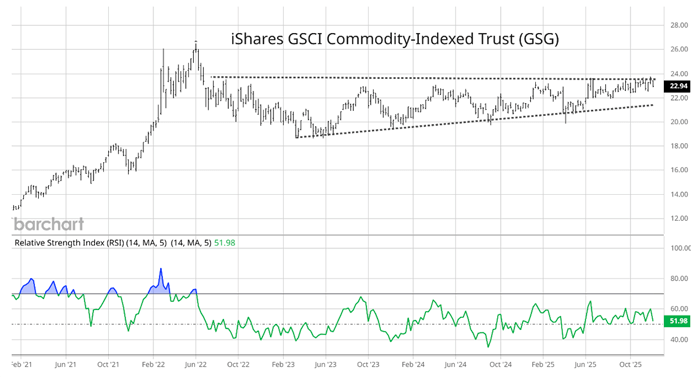
The dashed lines show an “ascending triangle pattern.” It’s characterized by a common resistance level along with a series of higher lows during pullbacks.
Price resistance is just below the $24 level, and you will notice that we are nearing the apex of the pattern (where the two dashed lines come together.
What’s also notable is that GSG has been trading in a tight range since June and is hovering just below the $24 resistance level as inflation is rising once again.
The weekly Relative Strength Index (RSI) has also been holding above the 50 level. The 50 level can serve as a key threshold between bullish and bearish price momentum.
Here’s what I’m watching for next.
I want to see GSG hold support at the $22 area, just like it has since June. A significant breakout could take place if GSG jumps over the $24 level.
If that happens, I’ll watch if the RSI confirms that strong price action with a move over 65 on the weekly chart.
If rising inflation can push GSG over the $24 level, that could mark the beginning of the next bull run in commodities.
Happy Trading,
Larry Benedict
Editor, Trading With Larry Benedict
Reading Trading With Larry Benedict will allow you to take a look into the mind of one of the market’s greatest traders. You’ll be able to recognize and take advantage of trends in the market in no time.
