Chip stocks have been among the biggest winners of the artificial intelligence (AI) boom… until recently.
AI hyperscalers are projected to spend over $700 billion this year alone. Money is being plowed into data centers and computing hardware to run AI applications, including semiconductors.
Chip stocks are seeing an earnings boost as the profit outlook keeps growing brighter. Semiconductors represent up to 95% of the internal hardware value for a data center, so they’re major beneficiaries of the capital expenditures.
That fueled strong gains for chip stocks. Starting in early April, the whole semiconductor sector took off and ran through the end of June. The VanEck Semiconductor ETF (SMH) went along for the ride.
But since then, SMH and many of its biggest holdings are struggling for traction. Now a key chart level is coming into play that could tip the next move…

Nearly half of the world's biggest money allocators are scrambling to reposition for what they expect to be the most volatile market in years. Larry Benedict isn't scrambling. He's seen this before. He says the Warsh Shock is setting up the most predictable
wealth-building window he's seen in 20 years… and there's one ticker right at the center of it. Click here to see how Larry is playing it.

The Ex-CIA economist is convinced the Trump administration is about to invest in this company. See why he's loading up on shares here.
Holdings in SMH include AI infrastructure stalwarts and companies seeing a sharp rebound in their earnings outlook. That includes names like Nvidia (NVDA), Advanced Micro Devices (AMD), and Micron Technology (MU).
Those stocks helped power a massive rally in a short amount of time for SMH, which gained 84% in less than three months. Here’s the chart below.
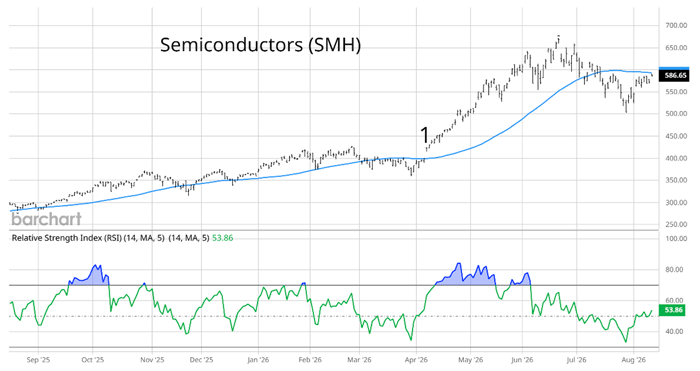
You can see that SMH was in a steady uptrend until “1,” which is when the gains really kicked in.
The ceasefire development between the U.S. and Iran sparked the gap higher in early April. That period also ran into the start of first-quarter earnings season, where positive earnings revisions from AI capital expenditures fueled more gains.
SMH ran all the way toward the $650 level in late June, when the rally started running out of steam. By that time, chart warnings were already showing that upside momentum in chip stocks was getting exhausted.
A partial retracement of gains was expected. But now investors are wondering if the worst of the decline is over.
How SMH handles a key chart level now in play should help tip whether the worst is over or if more downside is in store.
The sharp gains in SMH created the right conditions for a mean-reverting move lower, which was also flagged by the Relative Strength Index (RSI).
The RSI measures underlying price momentum. It started diverging negatively in June. Look at the chart again.
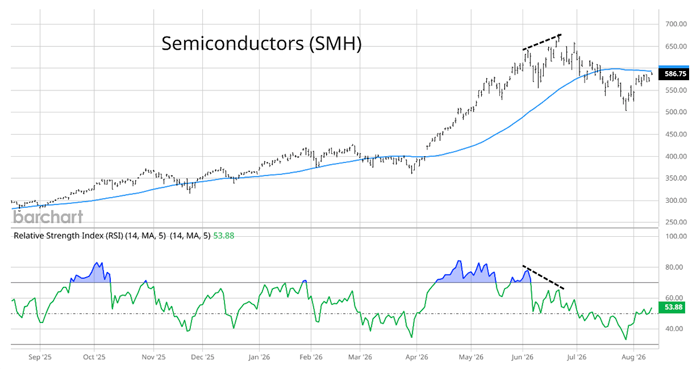
As SMH made higher highs in price into the end of June, the RSI started making lower highs (dashed lines). That showed upside momentum was starting to fade. SMH was also extended far above the 50-day moving average (MA – blue line).
A subsequent pullback in SMH took the ETF lower by 25%, which retraced about 50% of the entire rally since April.
While the RSI didn’t quite extend to oversold territory below the 30 level, it fell to the lowest level since the selloff in April 2025 following the trade war. That sparked a rebound off the $500 level, which has the next big test in play.
Look at the chart one more time.
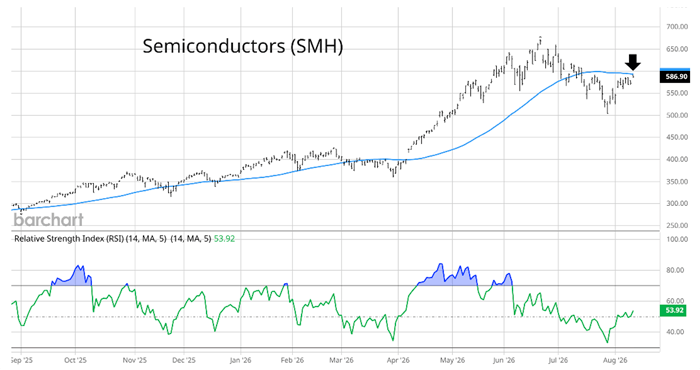
The bounce off the $500 level now has SMH pushing up against the 50-day MA from below at the arrow, which gives us the next big test to monitor. It’s common to see key support or resistance levels tested following a break… only for the trend to resume.
So if SMH stalls out below the 50-day, then watch for the $500 support level to come into play once again.
Regards,
Larry Benedict
Editor, Trading With Larry Benedict
Reading Trading With Larry Benedict will allow you to take a look into the mind of one of the market’s greatest traders. You’ll be able to recognize and take advantage of trends in the market in no time.