After the market’s dramatic rise, plenty of satisfied folks are sipping and sunning their way through summer vacations.
To be fair, what’s not to like about a market regularly making eye-watering new highs?
Retail investors’ appetite has pushed market favorites like Nvidia (NVDA) and Coinbase (COIN) to stratospheric valuations. And the Nasdaq and S&P 500 are up 41% and 32%, respectively, from their April lows.
When markets are rallying all the time, it’s easy to become complacent. You might think that going long (i.e., buying stocks) is the only way to go.
But trading stocks is not a one-dimensional deal. As the recent action in COIN shows, you need to be ready for any pullbacks.
In fact, capturing reversals from overbought and oversold levels has been a cornerstone of my trading success…
One of the first concepts new traders learn about is trend trading. You’re looking to profit from a stock trending in one direction.
To see an example in action, let’s pull up the COIN chart…
Coinbase (COIN)
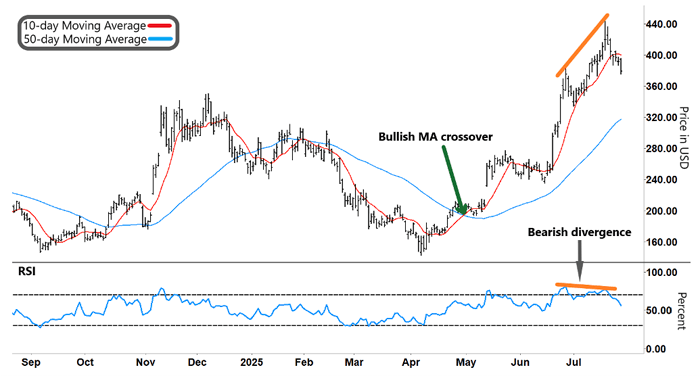
Source: eSignal
As you can see, the 10-day Moving Average (red line, MA) broke above the 50-day MA (blue line) in late April. A shorter-term MA crossing above a longer-term MA like this is seen as confirmation of an emerging uptrend.
And in this case, COIN rallied from around $200 to as high as $444.
But you need to ask yourself, how often does a move of this magnitude happen over such a short period of time?
Investors have become used to the recent rampant up moves in stocks. But history says that periods like this don’t occur very often. Even the most promising emerging trends can fade out just as quickly as they started.
What’s more, by the time you get in on a signal like an MA crossover (a lagging indicator), the move may have already run its course…
So the stock price could start tanking no sooner than you enter your position.
That’s why I prefer a different kind of strategy. I look for a move that has extended too far in one direction and look to profit when it snaps back the other way.
|
Tune in to Trading With Larry Live
Each week, Market Wizard Larry Benedict goes live to share his thoughts on what’s impacting the markets. Whether you’re a novice or expert trader, you won’t want to miss Larry’s insights and analysis. Even better, it’s free to watch. Simply visit us on YouTube at 8:30 a.m. ET, Monday through Thursday, to catch the latest. |
To see what I mean, let’s pull up the COIN chart again, concentrating on the right-hand side…
Coinbase (COIN)
Source: eSignal
The chart shows a diverging pattern (orange lines) between the COIN stock price and the Relative Strength Index (RSI), a momentum indicator. This coincided with COIN reversing sharply off its peak.
When the RSI is tracking lower from overbought territory, it shows declining momentum. That will eventually pull the stock price lower too…
The bigger that divergence becomes, the sharper that reversal can be – just as we saw here. And the bigger profit we can make in a short time.
This is just one signal in a broad array of indicators that I use. But it shows the kind of potential on offer from reversals.
That 10%-plus reversal off COIN’s peak could translate into a potential 40–50% return or higher in a short time using options. Options allow me to take part in a move and leverage my returns. All the while, I fully know my maximum risk – the price I pay for the option.
And because you can use options when stocks are oversold and overbought, that gives you far more trading opportunities. You can profit from up or down moves.
Better still is when you use them to capture outsized moves.
And when this market wakes up from its complacency, we could see many opportunities to profit from outsized moves using this strategy.
Happy Trading,
Larry Benedict
Editor, Trading With Larry Benedict
P.S. My top analysts and I have gone through every tick from over 1,200 days of price action in one of the most polarizing stocks in the market… Tesla (TSLA).
And what we uncovered will astound you.
We uncovered a pattern that just doesn’t appear in other stocks. It almost always results in a sharp snapback. And as a hint, it’s not human-driven…
If you’re curious to find out how it all works, then be sure to watch my latest briefing here.
|
Free Trading Resources Have you checked out Larry’s free trading resources on his website? It contains a full trading glossary to help kickstart your trading career – at zero cost to you. Just click here to check it out. |
Reading Trading With Larry Benedict will allow you to take a look into the mind of one of the market’s greatest traders. You’ll be able to recognize and take advantage of trends in the market in no time.
