After doubling since October last year, D.R. Horton (DHI) peaked in late July.
DHI is the largest homebuilder in the U.S. by volume. But after that peak, it retraced strongly and lost around a quarter of its value in just three months.
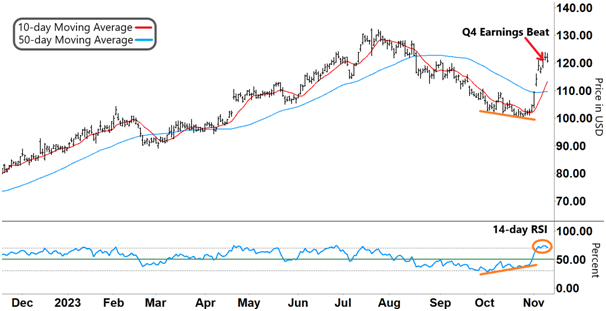
Yet late last month, a reversal pattern enabled DHI to find a base.
Then after the Fed’s November 1 meeting, the market leapt to the conclusion that rate cuts could be coming soon. That would be good for homebuilders.
DHI jumped as a result. And its earnings beat last week further propelled that move.
But DHI is now around 24% off its October lows. And Fed chair Jay Powell has since reiterated that the Fed will continue to raise rates if needed.
So let’s see if DHI’s bounce is overdone…
The chart of DHI below shows its clear uptrend carried over from last year.
The long-term 50-day moving average (MA, blue line) steadily climbed throughout this rally.
And apart from a brief period in March, the 10-day MA (red line) bullishly tracked above the 50-day MA.
Check out the chart…
D.R. Horton (DHI)
Source: e-Signal
That March dip also saw the relative strength index (RSI) briefly fall through support (green line). But apart from that, the RSI stayed in the upper half of its range throughout DHI’s nine-month rally.
As the chart shows, DHI’s peak and reversal on July 20 coincided with two bearish signals:
The RSI reversed from overbought territory (upper gray dashed line) and tracked back toward support. DHI’s retracement accelerated as the RSI broke deeper into the lower half of its range.
The 10-day MA crossed below the 50-day MA. And both MAs sank.
Yet DHI was already setting itself up for a potential bounce even before the Fed’s meeting…
Take another look:
D.R. Horton (DHI)
Source: e-Signal
Both the stock price and RSI were converging (orange lines). This is a common chart pattern that often precedes a reversal.
When momentum steadily climbs (lower orange line), it becomes increasingly difficult for a stock to continue falling.
And it will eventually push the stock higher.
DHI bounced as the RSI burst back through resistance and into its upper band. Likewise, the 10-day MA broke back above the 50-day MA.
But even after DHI’s earnings beat last week, the stock price initially stalled. And the RSI is stuck in overbought territory for now.
So what should we look for?
|
Free Trading Resources Have you checked out Larry’s free trading resources on his website? It contains a full trading glossary to help kickstart your trading career – at zero cost to you. Just click here to check it out. |
When a price bursts higher, it can be difficult to maintain that initial momentum.
That’s especially true in DHI’s case since the Fed has fought the market’s expectation that rates have peaked.
Plus, the overbought RSI could put DHI under ever more pressure.
Of course, the RSI trading in overbought (or oversold) territory is not enough for a potential trade on its own.
Instead, we need to see a clear RSI reversal before considering a short trade on DHI.
The RSI trading back at support could soon see DHI back down around $115.
Regards,
Larry Benedict
Editor, Trading With Larry Benedict
Do you think DHI will reverse? Let us know at feedback@opportunistictrader.com.
Reading Trading With Larry Benedict will allow you to take a look into the mind of one of the market’s greatest traders. You’ll be able to recognize and take advantage of trends in the market in no time.
