It’s hard to think of a sector this year that has attracted as much attention and controversy as oil.
With the price of crude trading at its highest levels in over a decade, oil has been a major contributor to rampant global inflation. Gas prices have risen nearly 50% in the U.S. in the last year alone.
As a result, that’s made oil a hot political issue.
Major oil and gas producers have been pushing back this past week against President Biden’s accusations of price gouging.
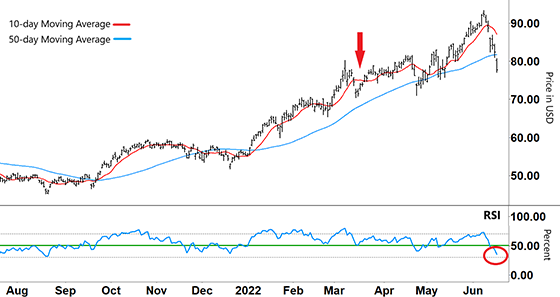
However, when we checked out the Energy Select Sector SPDR Fund (XLE) back in March (red arrow on the chart), we saw how its rally was anything but new.
In fact, XLE began rallying back in late 2020. This was well before inflation was on anyone’s radar… and a long time prior to the Ukraine invasion.
In the XLE chart below, the recent up-leg of XLE’s long-term uptrend began back in September 2021.
But after peaking almost two weeks ago, XLE sharply reversed. So, today I’m going to discuss what I see happening next.
Let’s check out XLE’s chart…
Energy Select Sector SPDR Fund (XLE)
Source: eSignal
The 50-day moving average (MA – blue line) shows XLE’s long-term uptrend.
The recent up-leg within that long-term uptrend started when the 10-day MA (red line) crossed above the 50-day MA in mid-September 2021.
Apart from the brief crossing the two MAs had back the other way in December 2021, the 10-day MA has stayed above (bullish signal) the 50-day MA since then.
There’s a similar bullish pattern with the Relative Strength Index (RSI)…
For most of the rally, the RSI has remained in the upper half of the band. The only time it broke support throughout the up move was during December 2021 and briefly in April.
That was, however, until recently…
Let’s take another look at the chart…
Energy Select Sector SPDR Fund (XLE)
Source: eSignal
After forming an inverse ’V’ from overbought territory (above upper grey dashed line), the RSI rebounded lower.
After breaking strongly down through support, the RSI is rapidly closing in on oversold territory (lower grey dashed line) – as shown by the red circle. The last time the RSI touched this line was back in August 2021.
Back then, the RSI formed a ‘V’ before rallying higher.
Then, after closely tracking resistance through late August and early September, the RSI broke into the upper half of its band – setting off the long-term uptrend.
Now, with the current move, this pullback from XLE’s June peak has seen the RSI go from overbought to near oversold in a little over a week… taking around 18% off XLE’s share price.
After such a dramatic fall, what am I expecting from here?
Right now, the pattern I’m keeping an eye out for is a potential repeat from August 2021.
If the RSI rebounds off or near the oversold signal, XLE could enjoy a sharp bounce… and potentially enable us to make a profitable trade.
Remember, our focus right now is to capture short-term moves. As always though, there are no guarantees.
However, when stocks get oversold within a long-term uptrend (such as with XLE) we must be ready to profit when it reverts to the mean.
Regards,
Larry Benedict
Editor, Trading With Larry Benedict
Do you think oil prices will be lowering anytime soon? Or do you think these prices are here to stay?
Let us know at feedback@opportunistictrader.com.
Reading Trading With Larry Benedict will allow you to take a look into the mind of one of the market’s greatest traders. You’ll be able to recognize and take advantage of trends in the market in no time.
