|
Larry’s note: Welcome to Trading with Larry Benedict, the brand new free daily eletter, designed and written to help you make sense of today’s markets. I’m glad you can join us. My name is Larry Benedict. I’ve been trading the markets for over 30 years. I got my start in 1984, working in the Chicago Board Options Exchange. From there, I moved on to manage my own $800 million hedge fund, where I had 20 profitable years in a row. But these days, rather than just trading for billionaires, I spend a large part of my time helping regular investors make money from the markets. My goal with these essays is to give you insight on the most interesting areas of the market for traders right now. Let’s get right into it… |
With the global shortage in semiconductors about to roll into next year, manufacturers are trying all sorts of different techniques to adjust to the limited supply.
Chips once destined for smart phones are being reallocated to more expensive products. Auto manufacturers are reprogramming software and redesigning circuit boards to use fewer chips.
Yet even with this newfound ingenuity, the shortage is here to stay. Those in the sector aren’t expecting supply to match demand until late in 2022… if not the first half of 2023.
In the meantime, unless demand drops, the microchip manufacturers will continue to play catch up.
When we last looked at the VanEck Semiconductor ETF (SMH) (red arrow in the chart below) on November 9, it was in the midst of a major move higher. Having climbed steadily all year (red trend line), SMH burst above the upper level (blue horizontal line) of its trading range in early November.
VanEck Semiconductor ETF (SMH)
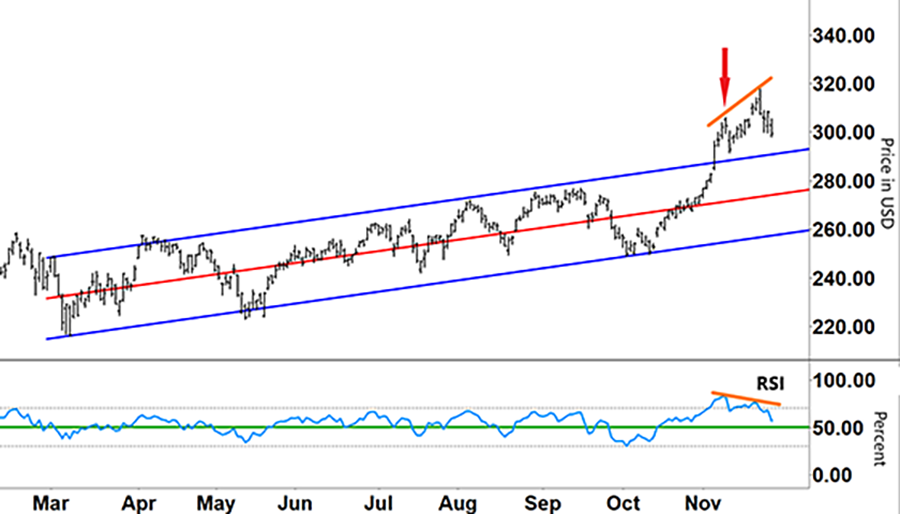
Source: eSignal
After a brief pullback, SMH went on to make its all-time high just shy of $320 on November 22 – more than a threefold increase from its March 2020 lows.
However, at the same time SMH was rallying to its record high, the Relative Strength Index (RSI) was showing that SMH was overbought, and momentum had peaked.
You can see the divergence between SMH’s share price and the RSI by the orange lines. This is something that often precedes a change in direction.
Now, with both currently trending down, let’s talk about what we can expect to happen from here…
The first test for SMH’s share price is to try and hold the upper blue line of the trading channel. If SMH can hold that line (with resistance changing to support), then that can form the base for a continued move higher.
However, what happens with the RSI will be key…
VanEck Semiconductor ETF (SMH)
Source: eSignal
As you can see, the RSI is closing in on the 50% support level (green line). If the RSI bounces off this level, along with the SMH share price holding above the upper blue line, then that will mean the current break higher should remain intact.
However, if the RSI breaks down through the 50% line, and pulls the SMH share price back below the upper blue line, the next test for the RSI is the lower grey (oversold) horizontal line.
When the RSI went into oversold territory in October, that coincided with SMH bouncing off support in its trading channel. This formed the base from which SMH rallied to its all-time high…
For SMH’s long-term uptrend to continue (red line), we’ll want to see a similar bounce off the RSI (lower grey line).
A break below the lower blue line of SMH’s trading channel would likely mean the current uptrend is over for now. However, right now, that’s a long way off. For that to happen, we would first need to see continued heavy selling like we saw last Friday.
For now, our immediate focus remains with the 50% support line on the RSI. We’ll continue to watch SMH closely as we scope out future trades.
Regards,
Larry Benedict
Editor, Trading With Larry Benedict
Do you see the microchip shortage getting better next year, or do you think we’re due for another year of product delays?
P.S. We’re excited to hear what you think of your new eletter, Trading With Larry Benedict. Let us know at feedback@opportunistictrader.com.
Reading Trading With Larry Benedict will allow you to take a look into the mind of one of the market’s greatest traders. You’ll be able to recognize and take advantage of trends in the market in no time.
