Larry’s Note: While most folks have been losing money in 2022, my subscribers have been compounding some serious wealth using the most lucrative strategy of my career…
I call it “Instant Cash Trades” because what the stock market gives investors on a good year… I’ve made in 24 hours in a volatile bear market.
So far, my subscribers have made 100% gains with over 177 trades. And now you could have the chance to potentially make $1,145 every 30 days.
That’s why on Saturday, November 19 at 8 a.m. ET, I’m revealing the entire ticker symbol of my next “Instant Cash Trade” – for free. To join me, click right here to automatically sign up.
It’s been a big year for oil…
As soon as 2022 kicked off, the oil price went on a massive rally. In around six months, the Energy Select Sector SPDR Fund (XLE) rallied 70%.
However, with the oil price overheating, XLE had a big pullback after peaking in early June. By the time XLE bottomed out in July, it had given back 30% of its gains.
Since then, XLE has been slowly but relentlessly grinding higher. And in just the past couple of weeks, it has taken out its yearly high.
Now, XLE is looking overextended again. So today, we’ll check out what’s in the cards from here…
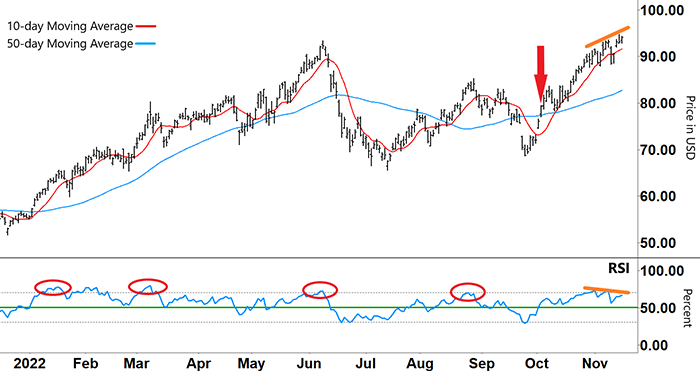
On the chart below, the 50-day moving average (MA – blue line) shows XLE’s long-term trend…
From January to June, there was a huge rally followed by a pullback. Then, the current bull run began in mid-August…
Take a look at the XLE chart…
Energy Select Sector SPDR Fund (XLE)
Source: eSignal
The strong rally in the first half of 2022 was supported by two key signals in the Relative Strength Index (RSI)…
Throughout the rally, the RSI remained mainly in the upper half of its range (above green line).
The retracements against that uptrend typically coincided with the RSI forming an inverse ‘V’ and reversing from overbought territory (upper grey dashed line) – as shown by the red circles.
The rally that began in July (after XLE’s 30% pullback) also topped out when the RSI reversed out of oversold territory in August (fourth red circle).
And the retracement after the August peak lasted right through until the RSI went into oversold territory (lower grey dashed line) in late September.
After the RSI formed a ‘V’ and then bounced higher, XLE’s current rally began.
When we last looked at XLE on October 6 (red arrow), the RSI had just broken through resistance and had gained a foothold in the upper half of its range.
Take another look at the chart…
Energy Select Sector SPDR Fund (XLE)
Source: eSignal
Since then, we’ve seen two further bullish moves from our MAs…
The 10-day MA broke back above the 50-day MA.
The 10-day MA has continued to accelerate above the 50-day MA.
However, the pattern that’s now forming in both the RSI and XLE stock price is warning me that we need to be ready for a potential change in direction.
So, what am I looking for around here?
Free Trading Resources
Have you checked out Larry’s free trading resources on his website? It contains a full trading glossary to help kickstart your trading career – at zero cost to you. Just click here to check it out.
In the bottom half of the chart, you can see the RSI has made an inverse double ‘V’ out of overbought territory.
You’ll also notice the second inverse ‘V’ had a lower peak than the first.
We also need to watch for the RSI’s next move…
If the RSI reverses off the lower orange line and makes another lower high, then that’ll add further confirmation that buying momentum is waning.
And that’s critical to what happens in the top half of the chart. Recently, XLE has made higher highs (upper orange line)…
If XLE’s stock price continues to climb while the RSI continues to make lower highs, then eventually the lower buying momentum will pull the stock price lower too.
This means XLE is vulnerable to a correction.
The good news for us is that a short trade might not be far away.
Regards,
Larry Benedict
Editor, Trading With Larry Benedict
In today’s mailbag, One Ticker Trader members thank Larry for trading strategy and results…
I’m a new investor and a One Ticker Trader subscriber for about two months. I’m very excited about the results you have been achieving in these last few months. I’m cautiously optimistic and wanting to participate on a very small scale.
– Larry A.
I love your One Ticker Trader! Since joining I’ve made consistent, small (and not so small) percentage wins. Thanks to you, I’m learning a new way of investing with options! I never would’ve ventured into options without your expert guidance.
Your instructions are helping me learn how it works and how to avoid large losses. Thanks to you, I’m growing my meager account and plan to faithfully remain an opportunistic trader. You’re the real deal!
– Linda J.
Thank you, as always, for your thoughtful comments. We look forward to reading them every day at feedback@opportunistictrader.com.
Reading Trading With Larry Benedict will allow you to take a look into the mind of one of the market’s greatest traders. You’ll be able to recognize and take advantage of trends in the market in no time.
