A crypto crash is underway.
Over $1 trillion has been wiped out from the total cryptocurrency market value since peaking in October. And not even the biggest crypto by market cap has been spared.
After topping out near $126,000 at the start of October, Bitcoin is now down 33% from the highs.
The downside move accelerated last week, with Bitcoin blowing through key support levels on the downside.
That’s leaving crypto traders wondering when Bitcoin will finally find a bottom.
Today, let’s unpack Bitcoin’s price action and see if the downside move is finally going far enough to deliver a trading opportunity…
Bitcoin has been hinting at a risk-off move since the summer.
That’s when Bitcoin stopped rallying to new highs alongside growth stocks like those found in the Invesco QQQ Trust, Series 1 (QQQ).
Bitcoin has a historical tendency to lead changes in the stock market’s trend. Investors’ appetite for speculation will often show up in cryptocurrencies before the stock market.
But back in July, Bitcoin made a high and settled into a trading range, bouncing mostly between the $123,000 and $108,000 levels, which you can see in the chart below.
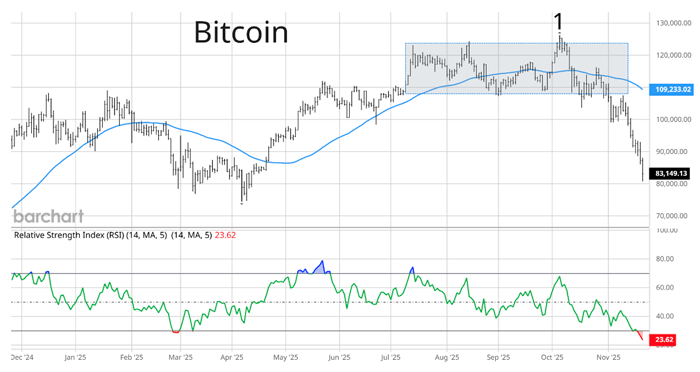
The shaded box shows Bitcoin’s trading range, including a failed breakout at “1.” The failed breakout was another momentum warning from Bitcoin, as it wasn’t catching up to the move higher in stocks.
From there, Bitcoin crashed.
After breaking below the multi-month trading range, Bitcoin is taking out key levels not seen since the trade war sell-off earlier in the year. Some investors are likely getting nervous, especially if they only bought Bitcoin earlier this year.
But I’m now seeing signs that the downside has gone too far, too fast…
After breaking down from its trading range, Bitcoin blew through a series of key support levels. Take another look at the chart:
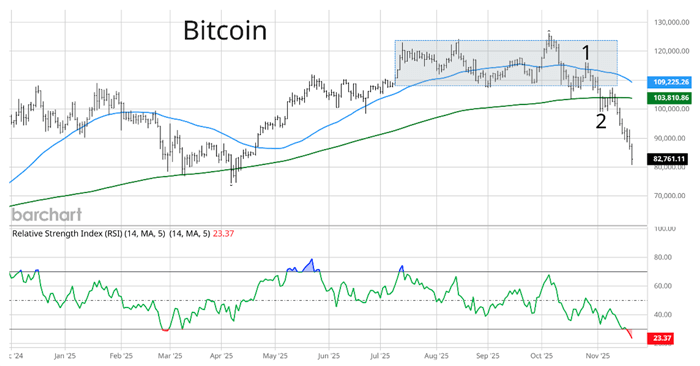
The initial fall below the trading range happened when Bitcoin lost support at the 50-day moving average (MA – blue line). We saw a failed test of the 50-day from below at “1.”
From there, Bitcoin quickly lost support at the 200-day MA (green line). That was also near price support at the $100,000 level at “2.”
After a week with volatile price action around the $100,000 level, Bitcoin started the next phase of the downtrend. It only took five more trading sessions for Bitcoin to take out the $90,000 level, which we haven’t seen since April.
But this is where signs are beginning to suggest that this move is overdone to the downside. Take one more look at the chart:
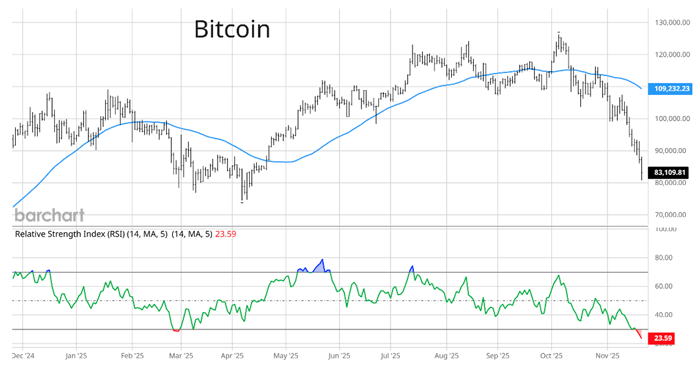
First, note the distance between Bitcoin’s current price and the 50-day MA. Bitcoin is currently trading 24% below the 50-day. That is the most Bitcoin has extended below the 50-day in over three years.
Also note the Relative Strength Index (RSI) in the chart. The RSI has fallen to the 23 level, which is deeply oversold. It’s also the lowest reading since 2022.
The weight of the evidence points to a downside move that’s getting stretched too far.
Whether or not Bitcoin truly heads into a new downtrend from here, the current move seems poised to take a breather. And a mean-reverting rebound could provide an interesting trade setup if you’re nimble.
If you’d like to see my favorite way to trade these types of moves in Bitcoin, you can check out my briefing on my strategy here.
Happy Trading,
Larry Benedict
Editor, Trading With Larry Benedict
Reading Trading With Larry Benedict will allow you to take a look into the mind of one of the market’s greatest traders. You’ll be able to recognize and take advantage of trends in the market in no time.
